PHYS 11.4: Quantum physics of solids |
PPLATO @ | |||||
PPLATO / FLAP (Flexible Learning Approach To Physics) |
||||||
|
1 Opening items
1.1 Module introduction
In this module, we shall give an overview of the properties of solids and how quantum mechanics helps us to understand these properties.
In the solid state, a material at a given temperature and pressure has a well–defined shape (as opposed, for example, to a liquid, which takes on the shape of its containing vessel). The forces of interaction between the atoms in the solid must therefore be strong and the bonds between them stable under the prevailing physical conditions. In Subsection 2.1, we look at the way in which quantum physics may be used to understand how these bonds are formed. In Subsection 2.2, we consider crystalline solids, in which the bonds allow the formation of regular arrays of atoms within the solid. We shall then consider some of the properties of solids that may be better understood using quantum mechanics. Of these, we shall concentrate on thermal properties and electrical properties. In Subsection 2.3, we give an introductory treatment of energy bands and the band theory of solids, which is used in Section 3 to explain electrical conductivity and why some solid elements are conductors of electricity, whereas others are semiconductors or insulators. We shall see how these properties depend on the temperature of the solid through the temperature coefficient of resistivity. The electrical properties depend predominantly on the electrons in the atoms of the solid.
The thermal properties, such as specific heat capacity and thermal expansivity are discussed in Section 4. They depend largely on the arrangement of the atoms in the crystalline lattice. We shall see how the values of these measured parameters give an indication of the behaviour of the forces that hold the lattice together. A quantum model of the heat capacity is necessary. Here we briefly discuss the Debye model and the Einstein model. The thermal conductivity of conductors is high, as is their electrical conductivity. We shall examine the reasons for this.
Study comment Having read the introduction you may feel that you are already familiar with the material covered by this module and that you do not need to study it. If so, try the following Fast track questions. If not, proceed directly to the Subsection 1.3Ready to study? Subsection.
1.2 Fast track questions
Study comment Can you answer the following Fast track questions? If you answer the questions successfully you need only glance through the module before looking at the Subsection 5.1Module summary and the Subsection 5.2Achievements. If you are sure that you can meet each of these achievements, try the Subsection 5.3Exit test. If you have difficulty with only one or two of the questions you should follow the guidance given in the answers and read the relevant parts of the module. However, if you have difficulty with more than two of the Exit questions you are strongly advised to study the whole module.
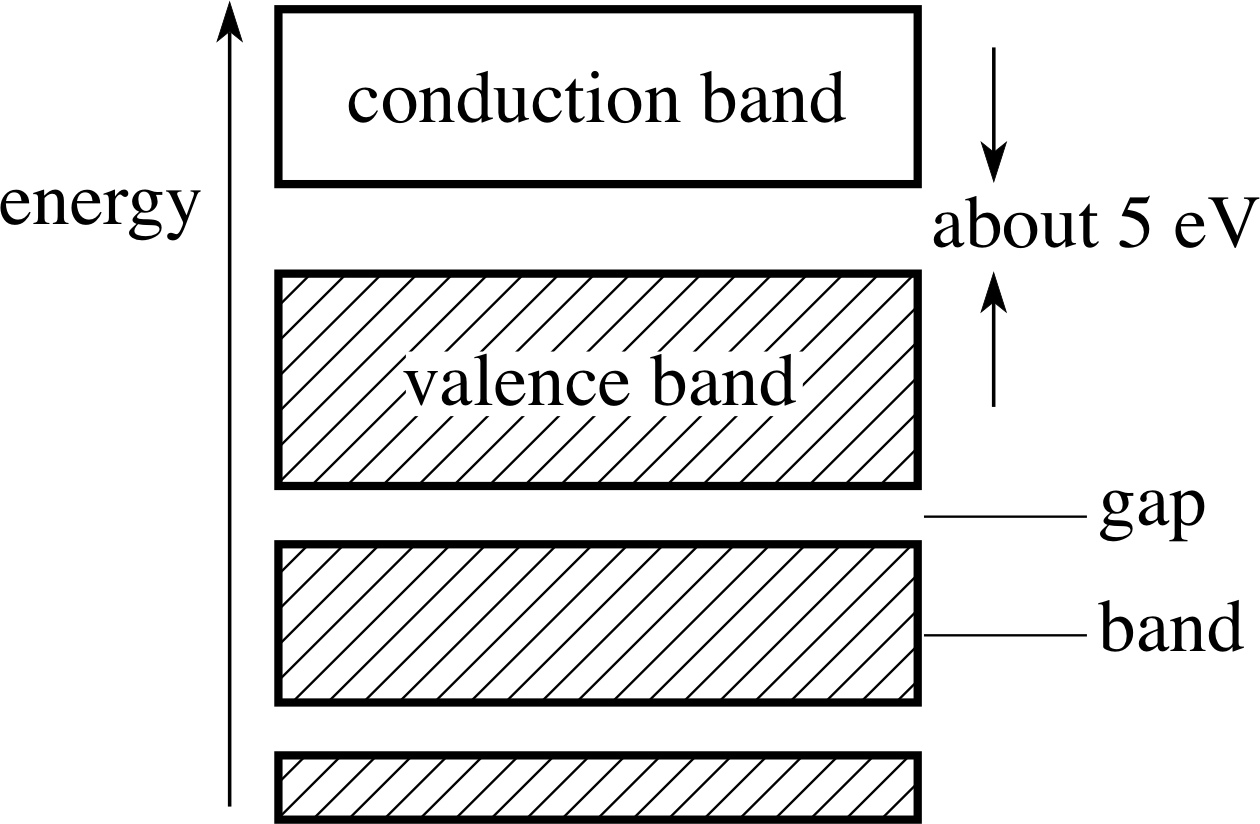
Figure 1 The energy band diagram for a solid element (see Question F1). (The white box represents empty energy levels; the hatched boxes represent occupied energy levels.)
Question F1
Figure 1 shows the energy band diagram of a solid element. Say whether the solid is a conductor, an insulator or a semiconductor of electricity. Explain your answer in terms of the Pauli exclusion principle.
Answer F1
The diagram (Figure 1) shows the energy levels that are available for the electrons to occupy. The shaded portion shows those levels for the solid that are occupied by electrons. The Pauli exclusion principle states that no two electrons may occupy the same energy state. It is this principle that is the reason for the electrons not being all in the lowest energy state. Once a state is occupied, a further electron will have to be in the state with the next highest energy.
For the solid to be an electrical conductor, the electrons must be able to acquire kinetic energy in order to move in a current. This necessitates electrons moving to (slightly) higher energy levels. The lower energy electrons cannot do this, because the states immediately above them are already occupied. Only the electrons near the top of the valence band may take part in the current.
In the diagram shown, the occupied zone fills a band of energies. There are no energy levels available immediately above the most energetic electrons. The Pauli exclusion principle therefore forbids the acquisition of the necessary kinetic energy, and the solid shown is an insulator.
The size of the band gap is the determining factor as to whether the element is an insulator or semiconductor. Thermal excitation cannot provide enough energy at room temperature to excite electrons by 5 eV, and the gap would have to be no more than about 1 eV for the material to be a semiconductor.
Question F2
Define the temperature coefficient of resistivity. Explain in terms of the band theory of solids why the coefficient is positive for conductors but negative for semiconductors.
Answer F2
The temperature coefficient of resistivity relates the resistivity ρ at temperature T to the resistivity ρ0 at temperature T0. Over a sufficiently small range of temperature, the relationship is linear:
ρ = ρ0[1 + α (T − T0)]
where α is the temperature coefficient of resistivity. If α is positive, resistivity increases with temperature;
if negative, it decreases.
There are two possible reasons why resistivity might change with temperature. First, the increased lattice vibrations will offer greater resistance to the flow of conduction electrons. Secondly, the electrons will acquire higher energies from the thermal energy source, leading to a larger drift velocity and so to a larger current and lower resistance.
For a conductor – with a valence band that is not full – the supply of conduction electrons is already plentiful and the former mechanism is predominant. In the case of semi-conductors, the valence band is full but the conduction band is sufficiently close – within 1 eV, say – that, at any temperature, thermal agitation will raise some electrons to the conduction band. However, this number is not high, and the conductivity of semi–conductors is very much lower than for conductors.
At increased temperature, the number of conduction electrons will be increased, and since this is the main mechanism by which conduction takes place at all, the conductivity will increase – or, in other words, the value of α will be negative. In the semi-conductor, the ‘lattice resistance’ is still a factor but not the predominant one.
Question F3
What does the thermal expansivity of a solid tell us about the shape of the graph of energy of interaction against separation for two neighbouring atoms in a crystal?
Answer F3
Figure 17 shows a typical energy interaction function for two neighbouring atoms in a lattice. The separation between the atoms will oscillate about the static equilibrium position due to thermal agitation as shown.
At higher temperatures, the energy of the agitation will be larger, leading to a greater amplitude of oscillation as shown in Figure 18. The positive value of the thermal expansivity is an external indication that the energy curve is not symmetrical about the 0 K equilibrium separation. This leads, as is shown in Figure 18, to an increased mean separation of the atoms from X to Y at the higher temperature.
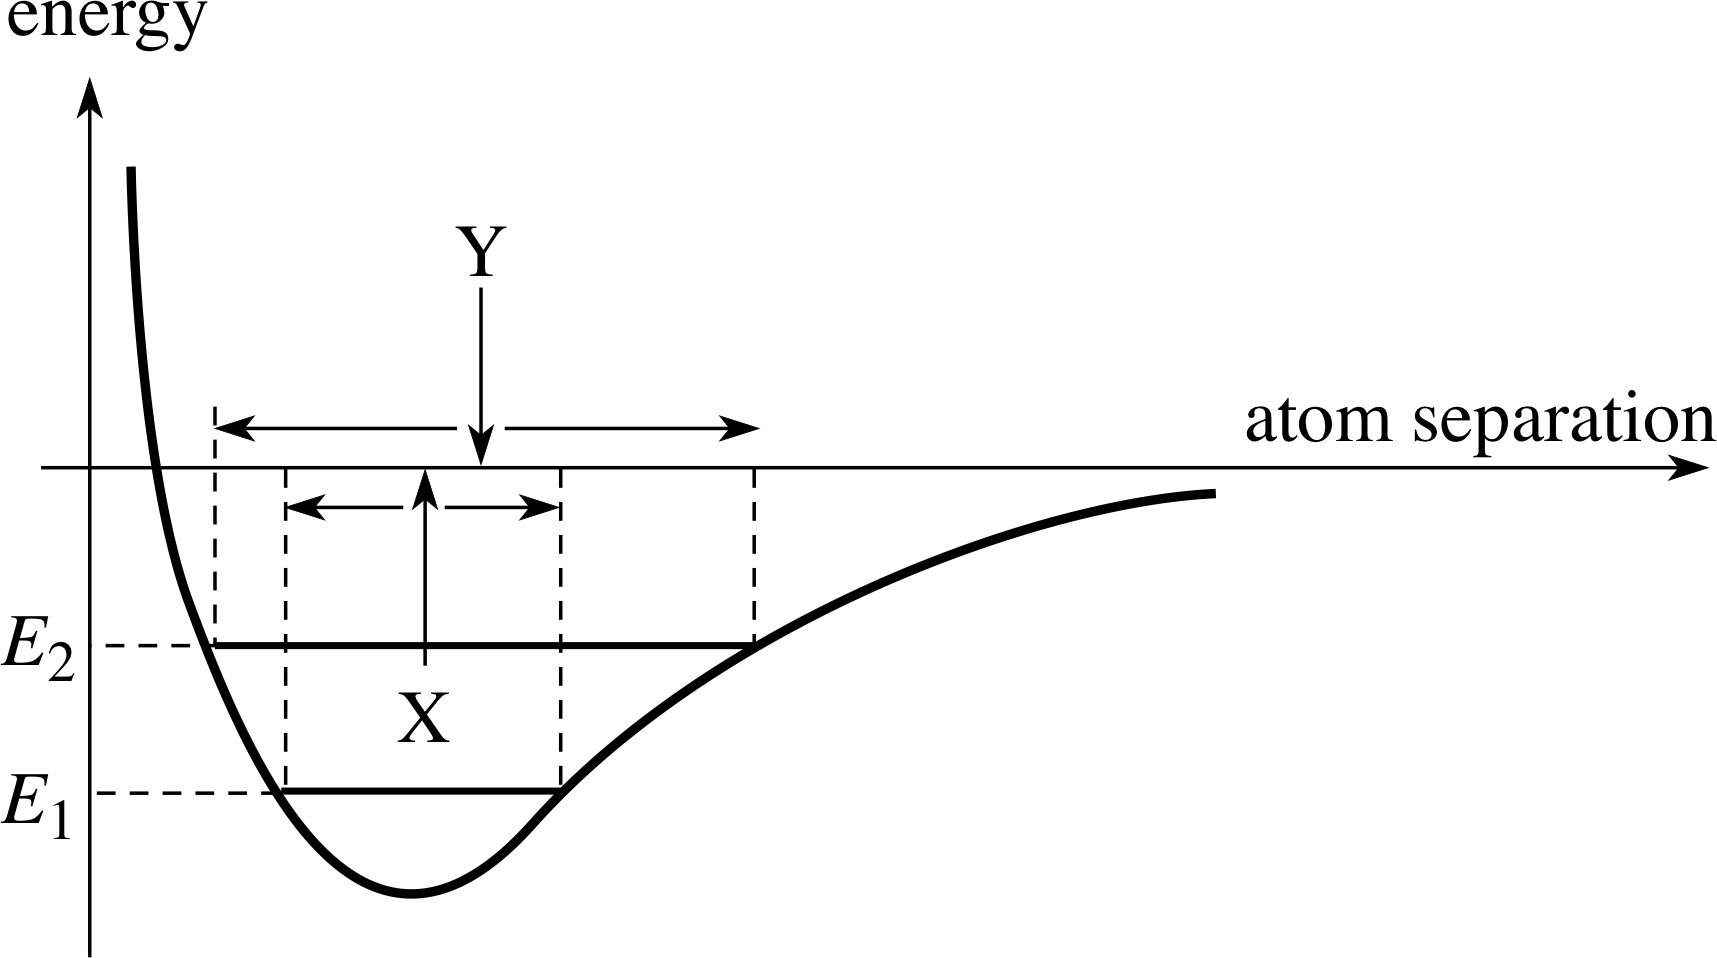
Figure 18 Thermal oscillation at energy E1 is centred on X. If the shape of the energy curve is not symmetrical about the equilibrium position, the thermal oscillation at energy E2 is centred on a different point Y.
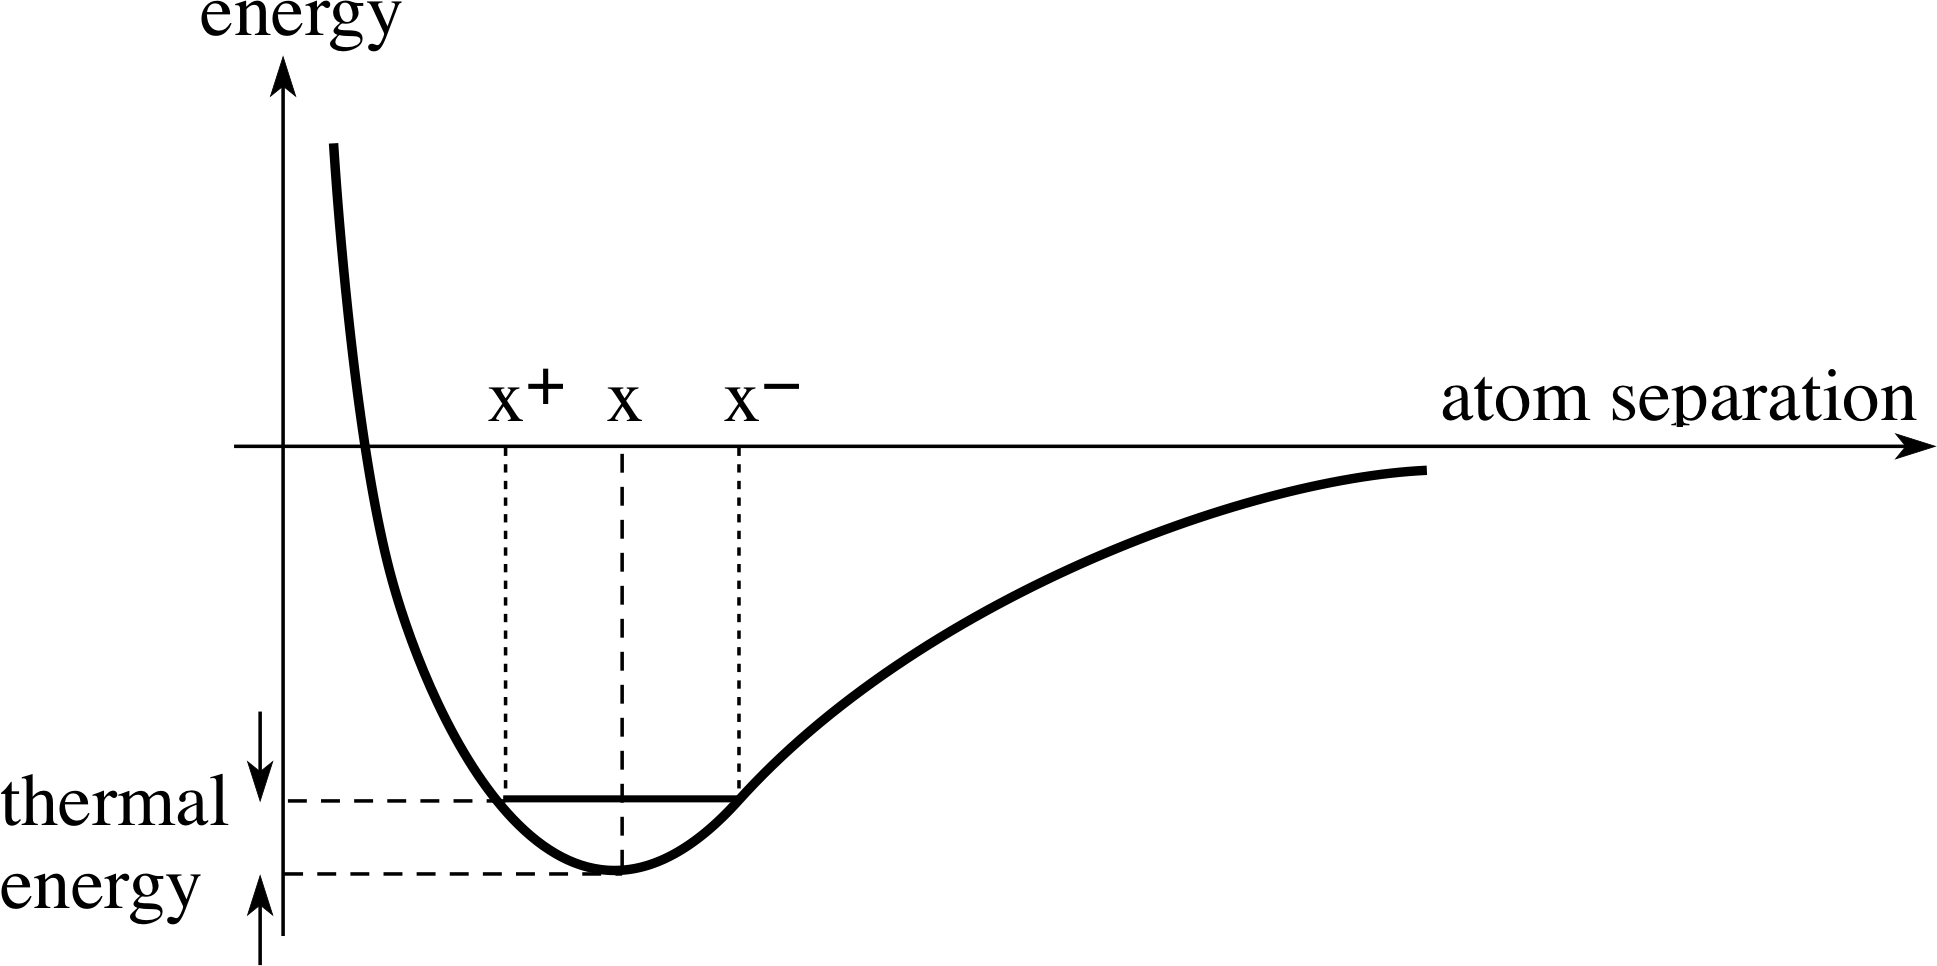
Figure 17 The energy function for the interaction of neighbouring atoms in a crystal lattice. The extent of the oscillation due to thermal energy is shown by x+ and x−.
1.3 Ready to study?
Study comment In order to study this module, you will need to be familiar with the following physics terms: atom, electron, proton, molecule, Coulomb force, potential and energytotal energy, Planck’s constant h, quantum, the time–independent Schrödinger equation, wavefunction, probability density, energy level, quantum harmonic oscillator, quantum numbers, s_p_d_f_notationspectroscopic (s, p, d, f) notation, spin_angular_momentumspin (of an electron), Pauli exclusion principle, (atomic) shells, degeneracy (of atomic energy levels), resistivity, conductivity (thermal_conductivitythermal and electrical_conductivityelectrical), specific heat capacity. You should also be familiar with differentiation and integration. If you are uncertain about any of these terms, then you can review them now by referring to the Glossary, which will also indicate where in FLAP they are discussed. The following Ready to study questions will allow you to establish whether you need to review some of the topics before embarking on this module.
Question R1
A particular stationary state of a one–dimensional quantum harmonic oscillator is described by the normalized spatial wavefunction (i.e. energy eigenfunction) i
${\it\Psi}\,(x) = \left(2\sqrt{\alpha\os}\middle/\sqrt{\pi\os}\right)^{1/2}x\exp\left(-\frac12\alpha x^2\right)$
where α is a constant.
Write down an expression for the probability that the oscillator will be found between x and x + ∆x.
Answer R1
The probability density for a stationary state with spatial wavefunction ψ (x) is | ψ (x) |2.
The probability of finding the quantum_harmonic_oscillatoroscillator between x and x + ∆x is therefore
$\lvert\,\psi(x)\,\rvert^2\,\Delta x = \left\lvert\,\left(\dfrac{2\sqrt{\alpha\os}}{\sqrt{\pi\os}}\right)^{1/2}\sqrt{\alpha\os}x\exp\left(-\frac12\alpha x^2\right)\,\right\rvert^2\,\Delta x = \dfrac{2\sqrt{\alpha\os}}{\sqrt{\pi\os}}\alpha x^2\exp(-\alpha x^2)\,\Delta x$
Question R2
The electrons in an atom are in the states denoted by 1s22s22p. How many electrons does the atom have? What can you say about their spins? Why is 1s3 not a possible arrangement?
Answer R2
The notation indicates that there are two electrons in the 1s (l = 0) state, two in the 2s (l = 0) state and one in the 2p (l = 1) state. There are therefore five electrons in all. Each l level has 2(2l + 1) states, the factor two arising from the two possible spin orientations (ms = +1/2 or −1/2). The s states therefore have two electrons, each with opposite spin. The p state has one which may be in either orientation. The Pauli exclusion principle says that no two electrons may occupy the same state. The 1s level only has two states. A third electron may not therefore be accommodated in it.
(For details about this notation see under electronic configuration in the Glossary.)
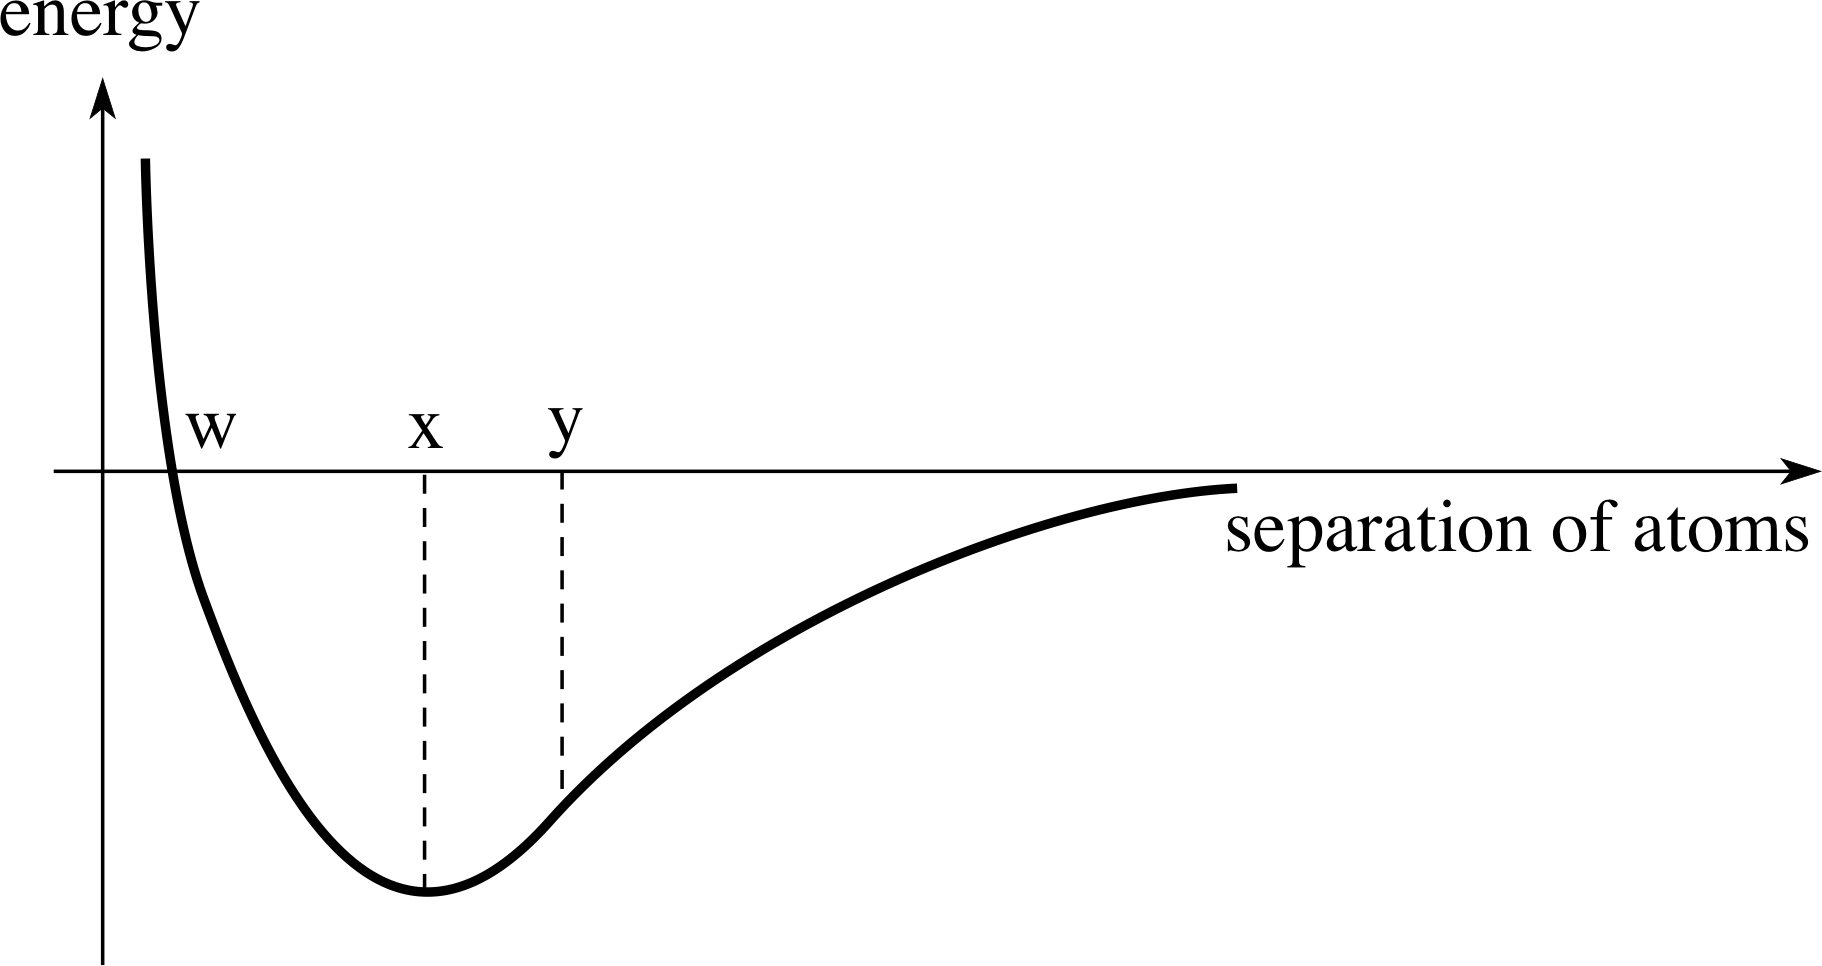
Figure 2 The energy of interaction between two atoms.
Question R3
Figure 2 shows the energy of interaction between two atoms as a function of their separation. Does the equilibrium separation of the atoms correspond to point w, point x or point y?
Answer R3
The equilibrium position is located at the minimum of the curve. The equilibrium separation is therefore indicated by x in Figure 2.
2 General considerations of the solid state
2.1 The formation of bonds between atoms
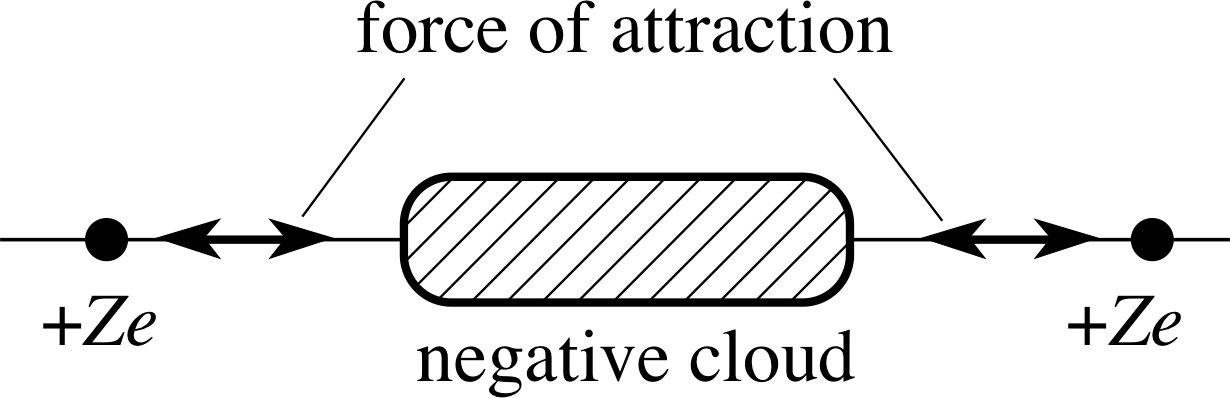
Figure 3 A negative electron cloud provides shielding ‘glue’ between the positive nuclei.
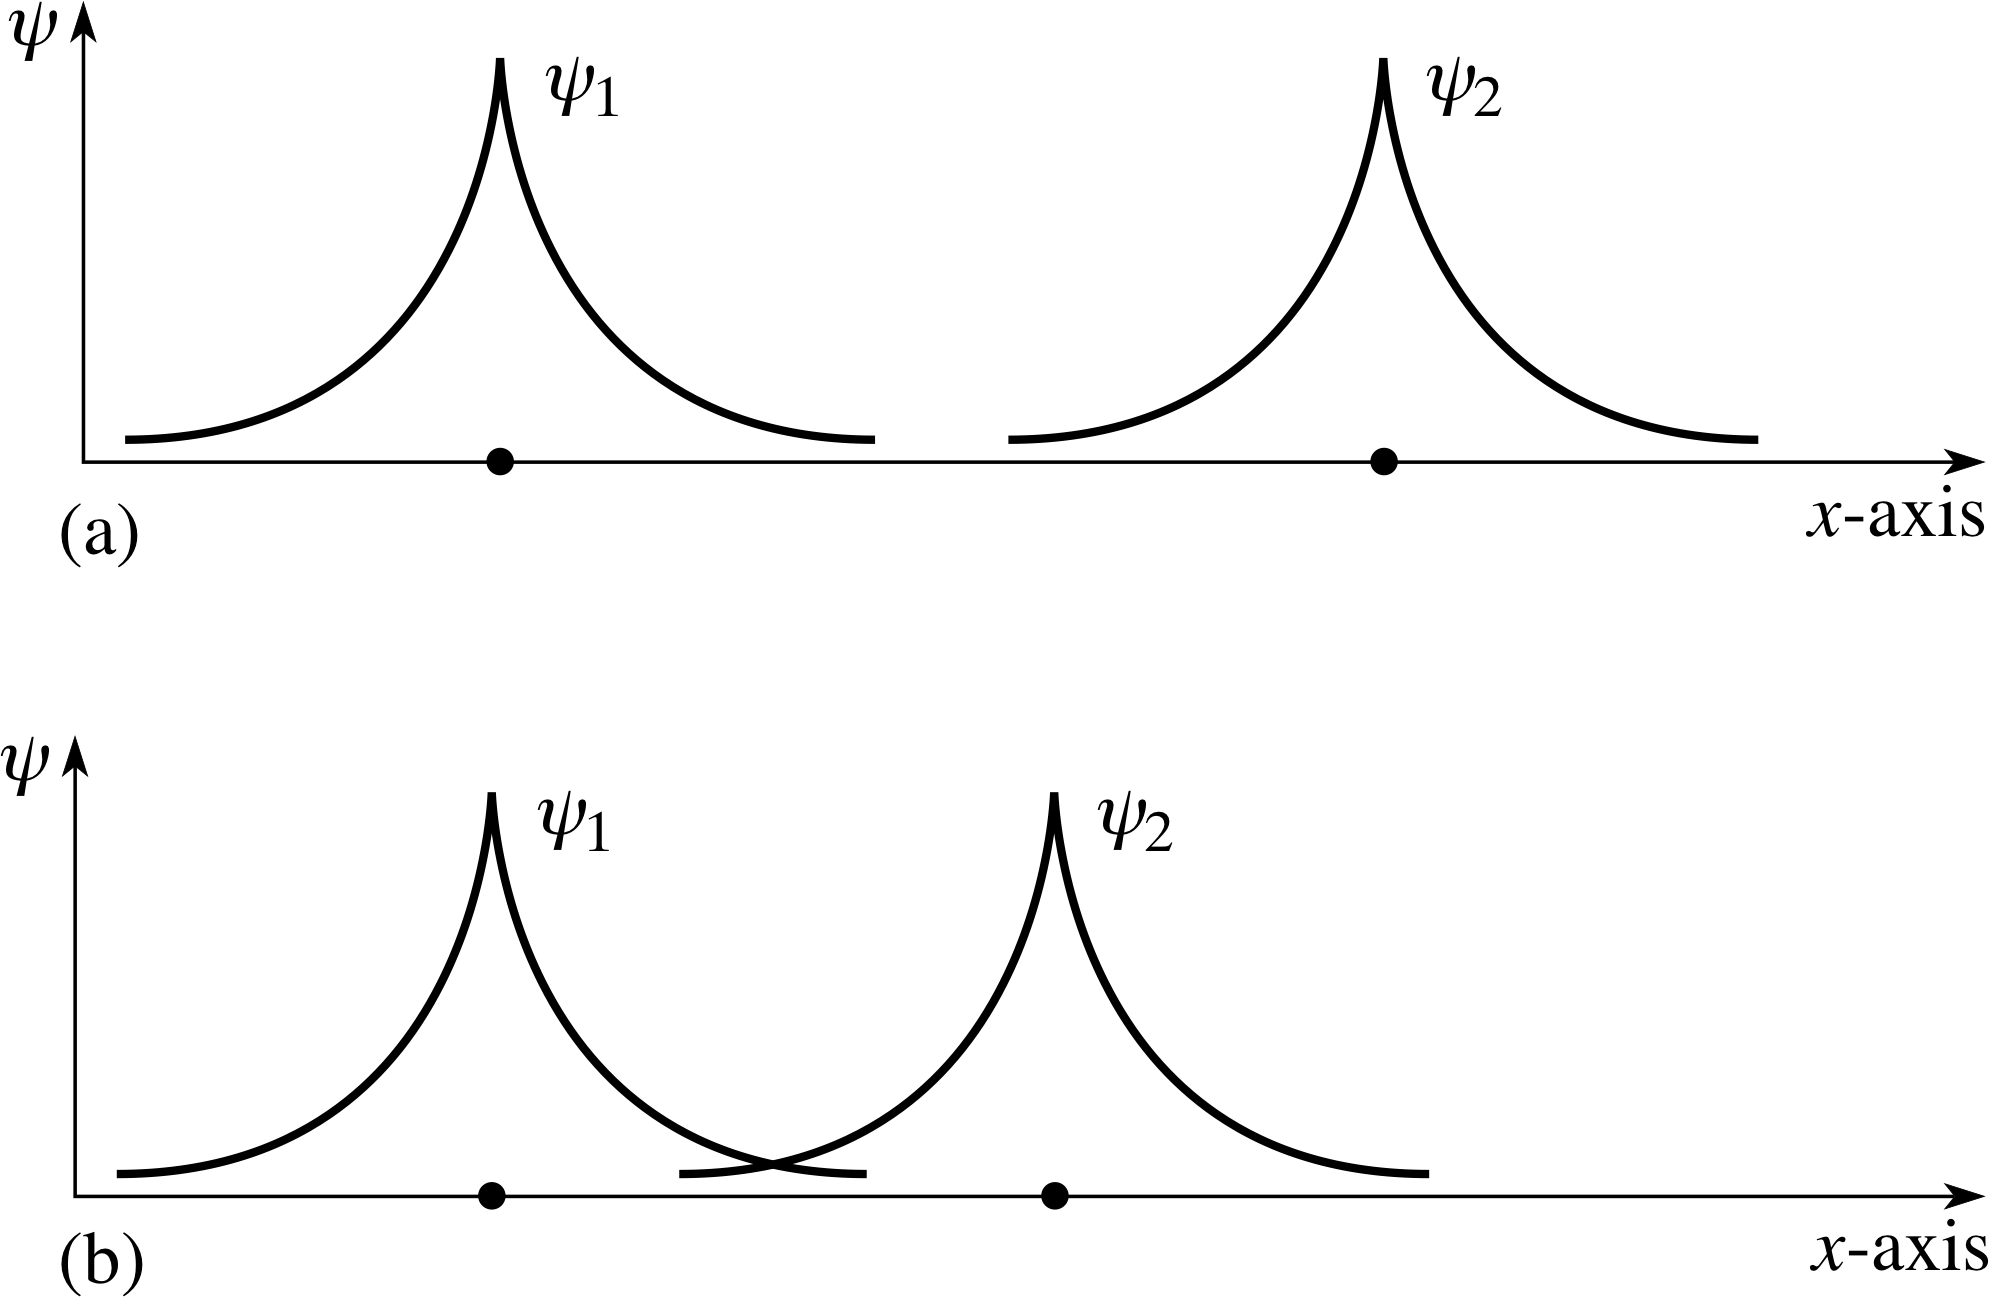
Figure 4 (a) The spatial wavefunctions of well–separated hydrogen atoms. (b) When the nuclei are closer together, the spatial wavefunctions start to overlap significantly.
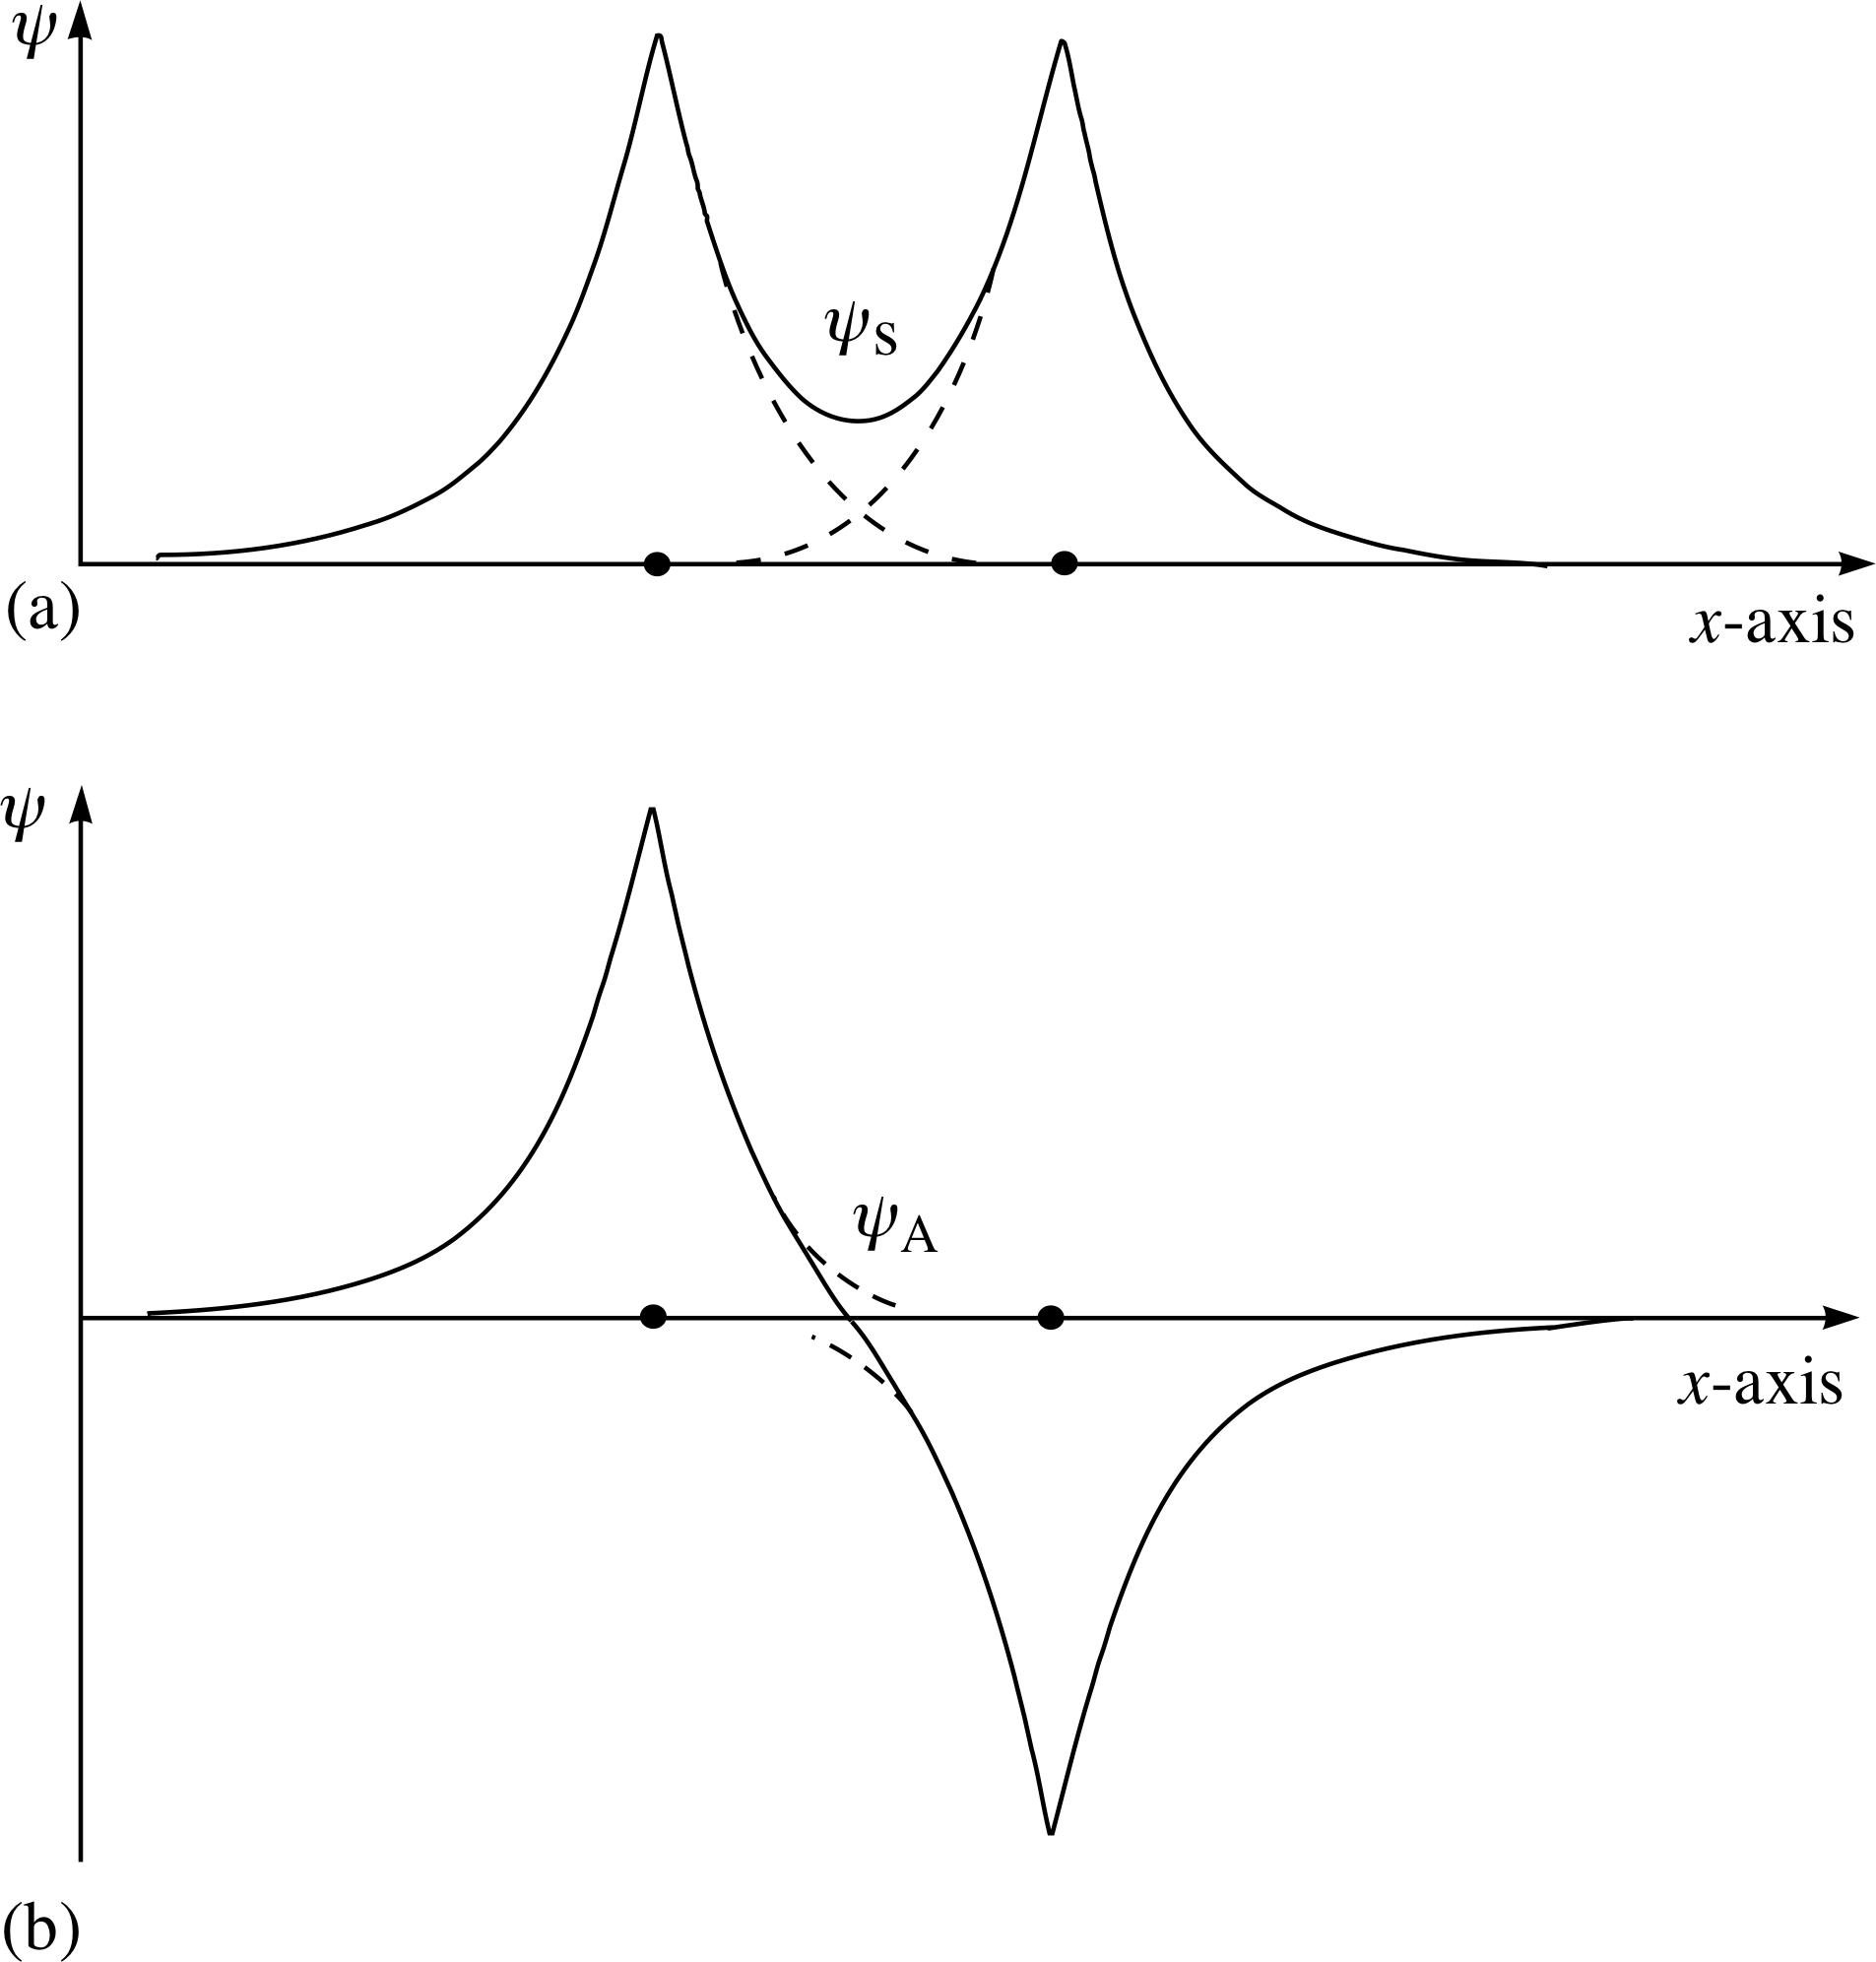
Figure 5 (a) A possible combined spatial wavefunction (shown by the solid line) of the hydrogen molecule. The wavefunctions have interfered constructively to give a spatial wavefunction ψs that is symmetric. (b) In the case where the interference is destructive an antisymmetric spatial wavefunction ψa is formed.
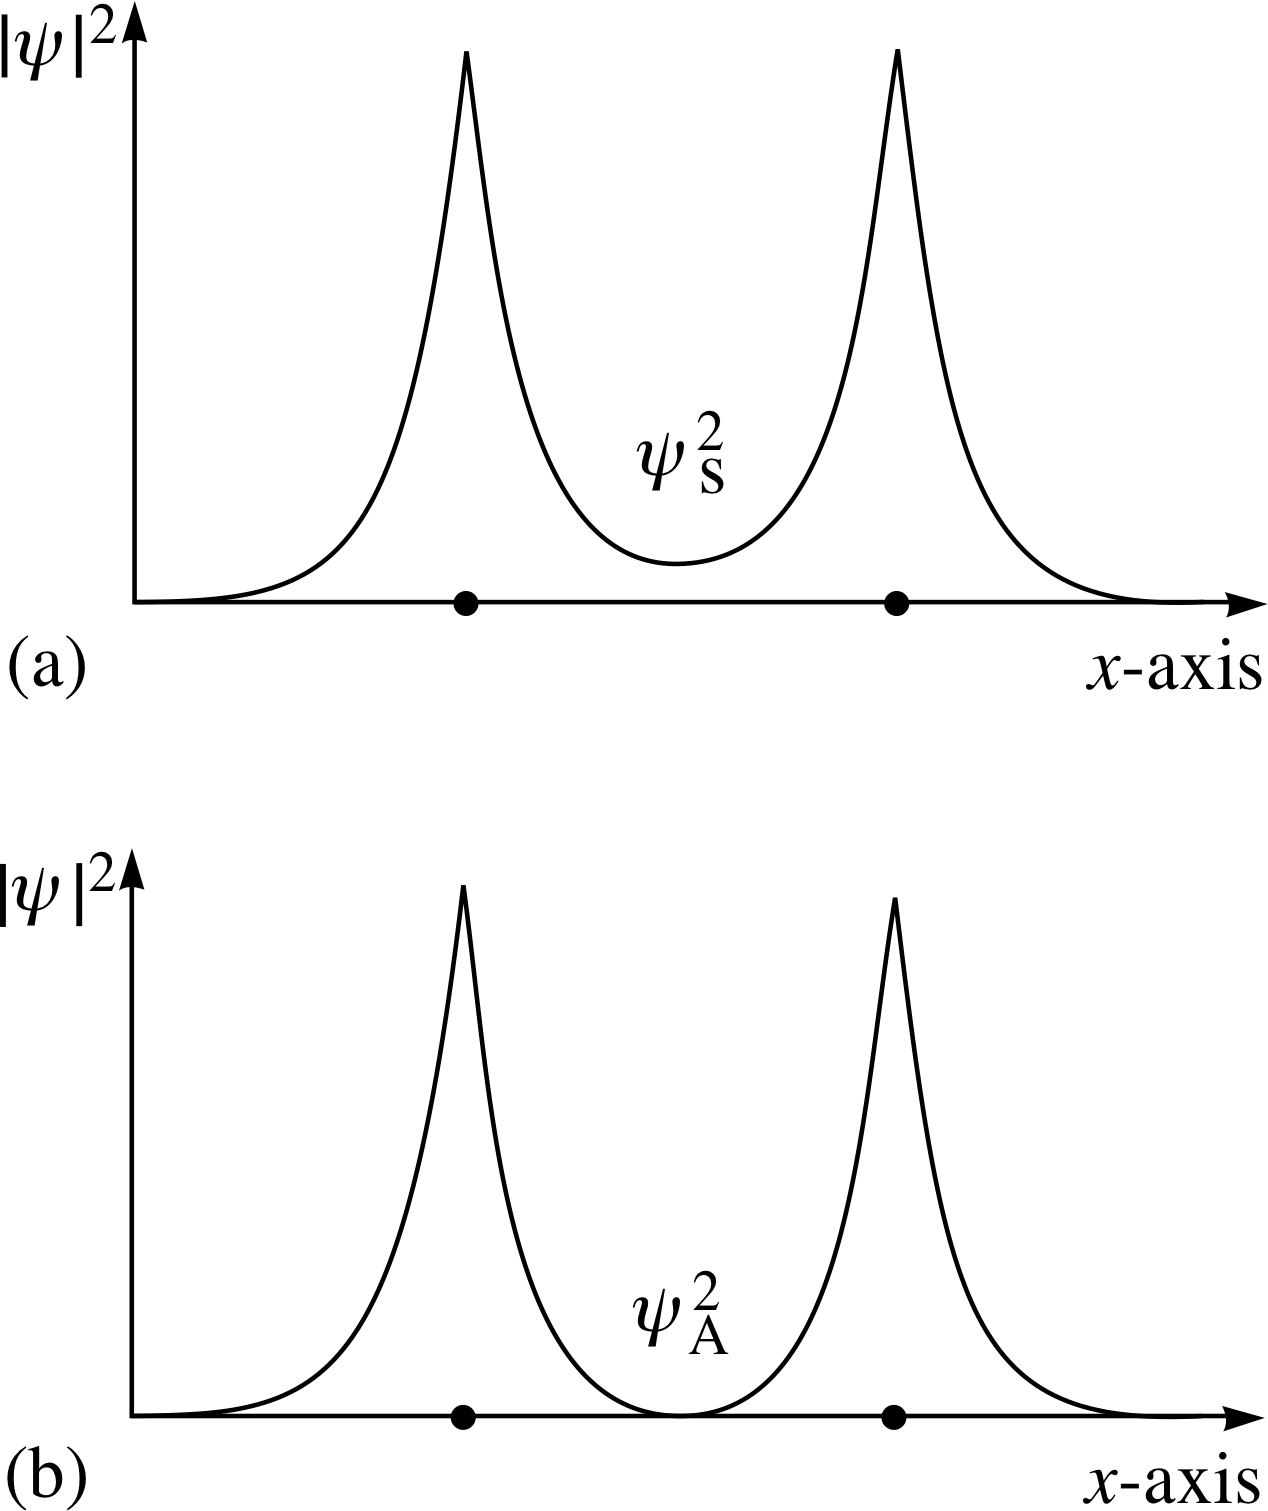
Figure 6 (a) The probability density function for the symmetric spatial wavefunction ψs. (b) The probability density function for the antisymmetric spatial wavefunction ψa.
A solid is made up of interacting atoms (or ions or molecules) in the form of a stable configuration. i The nuclei of the atoms are electrically positive; their electrons are electrically negative. The force that holds the electrons to the atomic nuclei is electrical. The nuclei are dense concentrations of positive charge, confined within a region of space of radius of the order 10−15 to 10−14 m. The electrons are more widely dispersed, typically within 10−10 to 10−9 m of the nucleus, and so there are much less dense concentrations of negative charge. A lone atom is electrically neutral; the positive protons in the nucleus have a total positive charge equal but opposite to the total negative charge of the electrons.
Consider two atoms being brought closer and closer together. At a large distance apart, where the nuclei are well separated and the electron clouds i around them do not overlap, the atoms will exert no appreciable force on each other. Each atom appears neutral to the other. At the other extreme, when the nuclei are much closer than the atomic radius, there will be a strong force of repulsion between the nuclei. Between these two extremes, there may be a force of attraction between the two atoms – with the electrons shielding the nuclei from each other to some extent.
The presence of the electrons between the nuclei will ‘mediate’ a force of attraction between the nuclei (see Figure 3). The electrons will of course repel each other, but their lower density will make this less effective, and the balance of the force between the atoms as a whole will be one of attraction. It is not obvious from classical physics that the energy is lower when the two nuclei have electrons distributed over a region (bond) between them but quantum mechanics provides this result convincingly.
How does quantum mechanics affect the situation? We shall start by looking at the simplest case, in which two hydrogen atoms – each consisting of one proton and one electron – come together. Each atom has an electron cloud described by a spatial wavefunction ψ (x). When far apart, these do not overlap – Figure 4a. Suppose that the nuclei are brought closer together so that the spatial wavefunctions of the individual electrons do overlap – Figure 4b. The situation is now changed. The electron from each atom has a finite probability of being in the ‘space’ of the other atom. Also, since electrons are identical particles, we may not assign them uniquely to one atom or the other – we must treat the two atom system as an entity and solve the Schrödinger equation for the two atom system.
The spatial wavefunction of the new two–nucleus molecule may be constructed from the spatial wavefunctions of the individual electrons – either constructively as shown in Figure 5a or destructively as shown in Figure 5b. i
From these possible spatial wavefunctions, we may calculate the probability densities: these are shown in Figures 6a and 6b.
What do these tell us? Figure 6a indicates an enhanced probability of finding negative charge between the two protons, whereas Figure 6b indicates a reduced probability (even zero at the half–way point).
In Figure 6a we see that the electrons spend more time within the region of negative potential energy, between the positive nuclei; this reduces the energy of the symmetric (bonding) state as compared to that of the antisymmetric (non-bonding) state and makes the bonding state energetically favoured. Also, in terms of the Heisenberg uncertainty principle, the electrons are rather more confined around the positive ion locations in the antisymmetric state and this also tends to increase the energy.
So the two atoms are bound together. What is the stable configuration? It is the one with the lowest energy. We can calculate the energy as a function of the separation of the protons. The separation that gives the lowest energy will be the equilibrium state. This, as shown in Figure 7, corresponds to a proton separation of 0.074 nm and an equilibrium energy of the molecule of −32 eV.
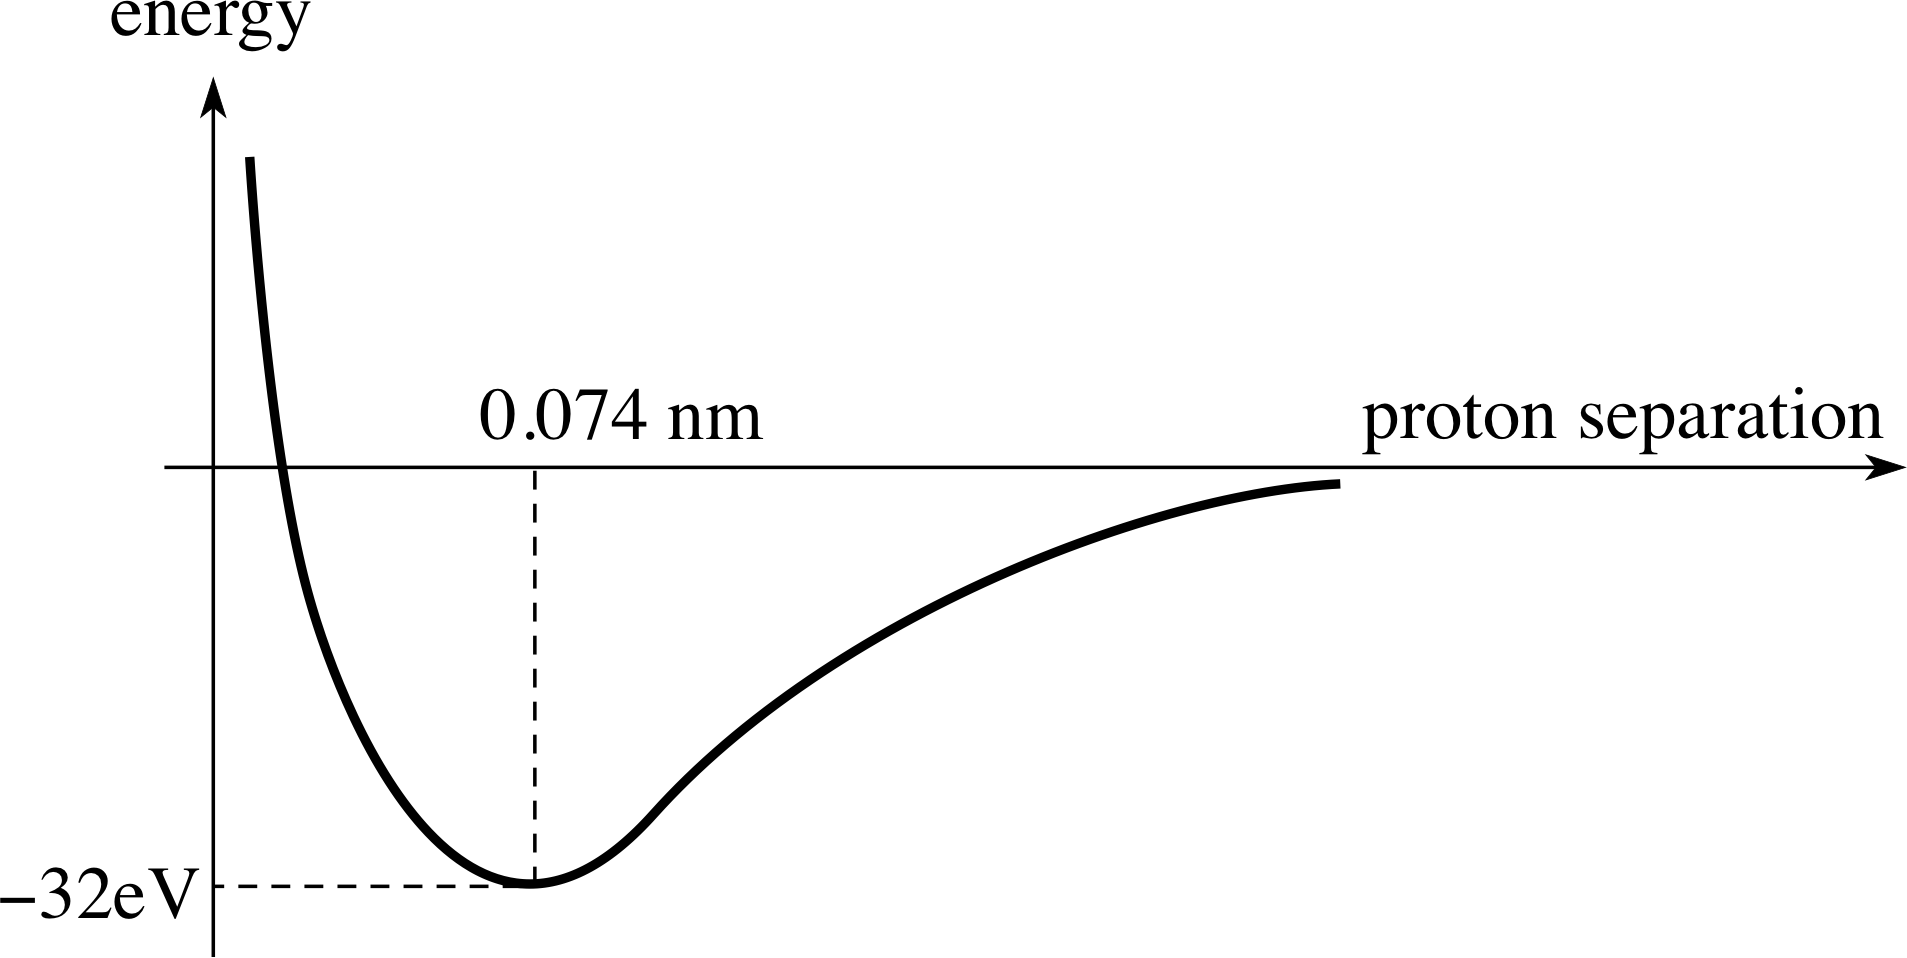
Figure 7 The energy of the symmetric state of the molecule depends on the separation of the protons. The equilibrium state corresponds to the minimum value of this energy. The anti–symmetric state has higher energy at all separations.
We have illustrated the way in which the binding together of two atoms can be accounted for by quantum theory. The case we have considered is, of course, a special one. The two hydrogen atoms, each with a single 1s electron, bond to form the H2 molecule. We cannot add a third atom to form an H3 molecule because there is no 3 electron state of sufficiently low energy to favour bonding. i The H–H bond is said to be saturated_bondsaturated. As shown in Figure 5a, it is a bond characterized by an increased electron density between the nuclei. Such a bond, whether saturated or not, is called a covalent bond.
Other types of bond are possible for more complicated atoms. We shall give one simple example.
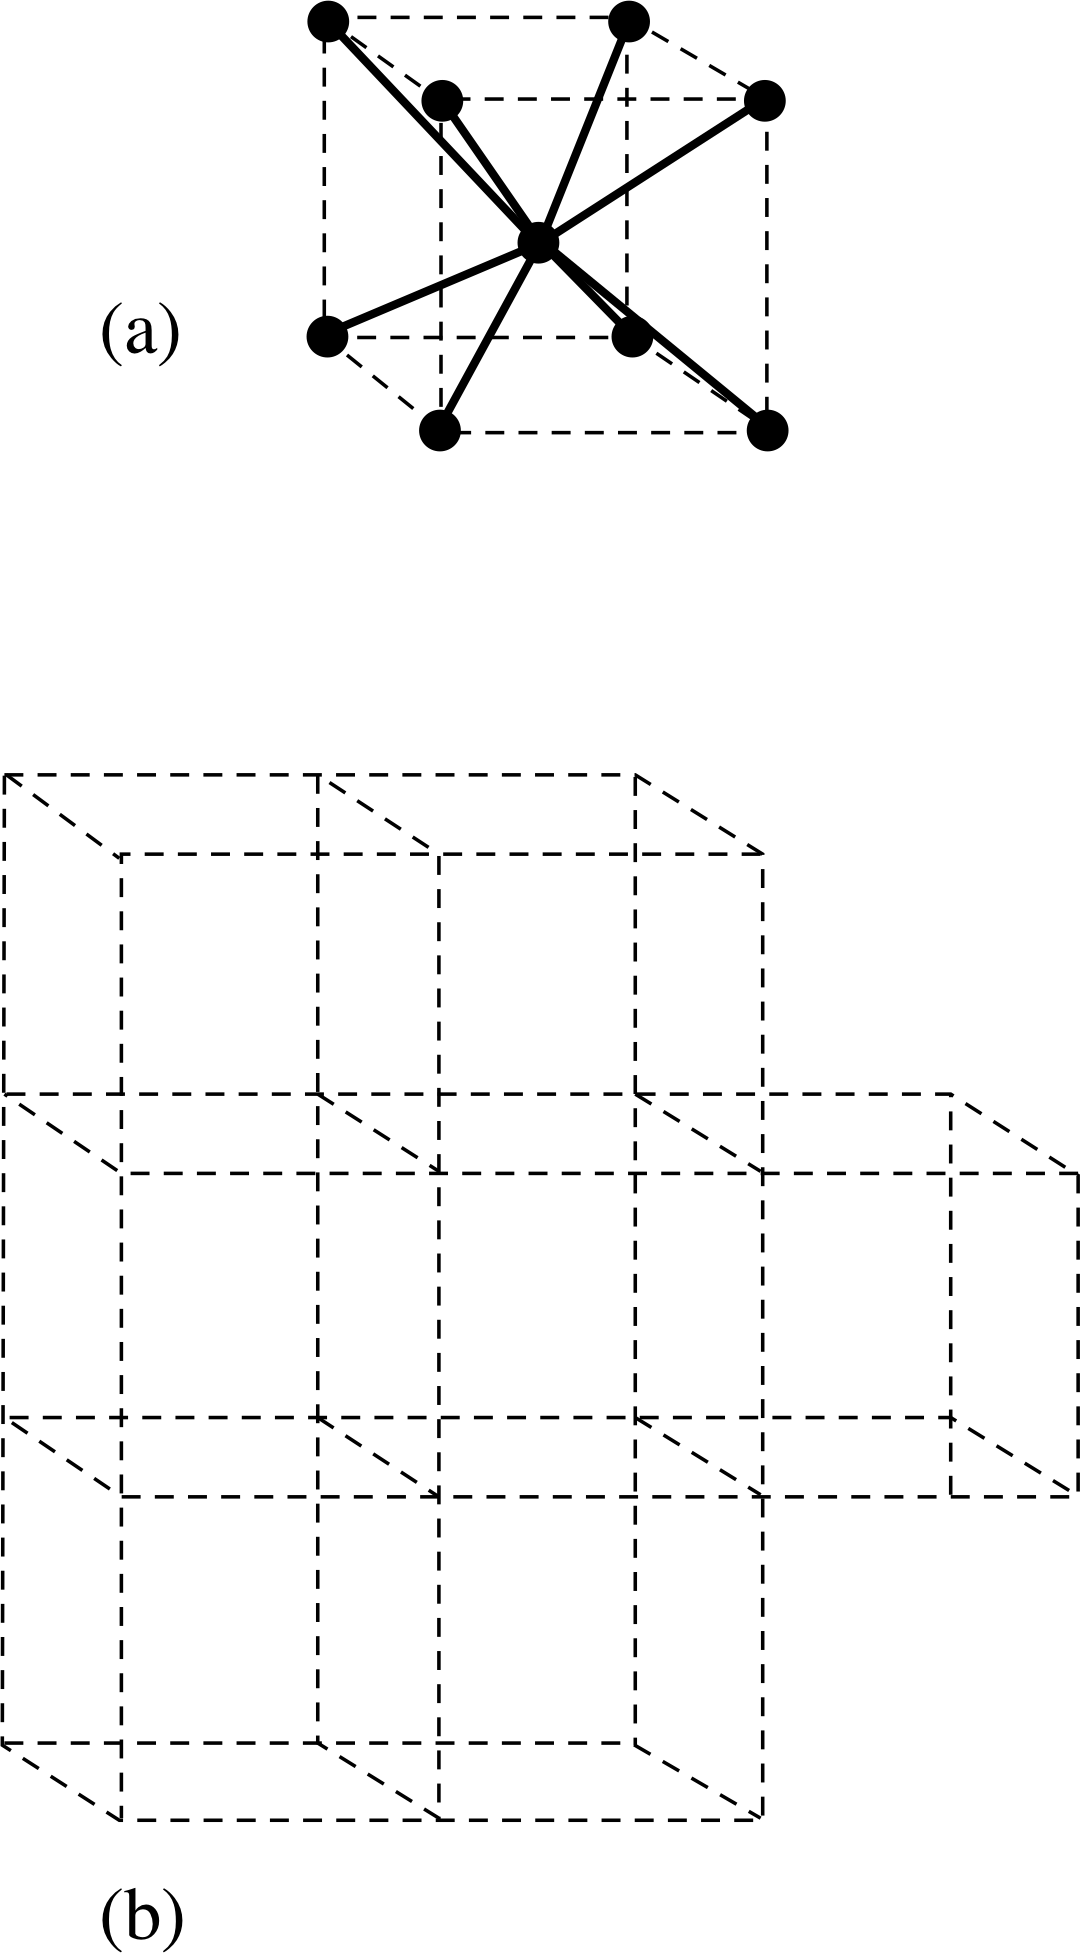
Figure 8 The body–centred cubic structure of lithium. (a) Each cell has an atom at each corner of an imaginary cube and one at its centre. There are eight nearest neighbour bonds shown by bold lines. (b) The cells occur repetitively throughout space.
Consider the interaction of two atoms of lithium in their ground state. Lithium has three electrons – two 1s electrons (with opposite spins to satisfy the Pauli principle) plus one 2s electron in the n = 2 shell. The electron configuration is denoted 1s22s. If these two atoms are brought together, there will again be the possibility of a covalent bond involving, in this case, the 2s electrons. However, unlike the hydrogen case, there are not just two states involved. This is because for n = 2, there are both 2s and 2p levels all at about the same energy. For the 2p states, there are a further six electron states available (ms = ±1/2 for ml = −1, 0 or +1). Therefore, following the formation of the Li2 molecule, the bond is not saturated and it will still be possible to form Li3, Li4, and so on.
Lithium at room temperature is a solid; it is also an electrical conductor. Why should that be so? To answer this question we must take a more detailed look at the atomic interaction. Since a lithium atom can bond with more than one other lithium atom, the stable arrangement of lithium atoms that has the lowest energy is a crystalline structure in which the atoms form a regular three–dimensional array. This is characterized by a lattice made up of a typical unit cell which repeats itself in all directions. The unit cell for lithium, and the way in which several cells stack together, are illustrated in Figure 8. The cell has a lithium atom at each of the eight corners of a cube plus one at the centre of the cube. Each lithium atom therefore has eight nearest neighbours and it forms a bond with each of them. So with one (the 2s) electron per atom contributing to the bond, each bond involves one quarter of an electron, on average, rather than the two in the ordinary covalent bond such as that which holds together the hydrogen molecule.
This bond is therefore by no means saturated. Indeed, in the case of the lithium lattice, it does not even involve the localization of a particular electron with a particular atom. The electrons are effectively free to move through the lattice – an effect that contributes to the electrical conductivity of the solid. This type of bond is known as a metallic bond.
We shall not go on to consider any further types of bond. The two we have mentioned – the covalent and the metallic – will be adequate as illustrations.
2.2 The lattice structure of solids
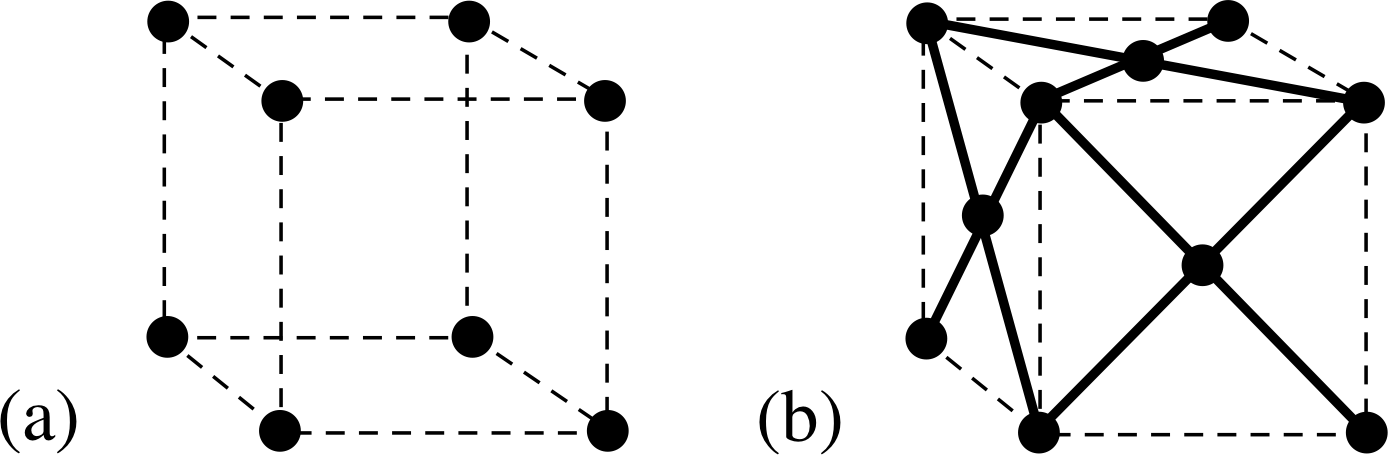
Figure 9 (a) The simple cubic lattice. (b) The face–centred cubic lattice. For clarity only visible faces are shown. It should be noted that these lattices are actually arrangements of points in space, not of atoms. There may be one, two or many atoms associated wth each lattice – it doesn’t matter as long as the arrangement is the same at every lattice point in a particular structure.
We have considered an example – lithium – which has a body–centred structure held together by metallic bonds. There are other possible lattice structures; the other cubic ones are shown in Figure 9. Which one a particular element will adopt depends on the detail of its atomic structure.
So far, we have considered the properties of the electrons in the atoms. But what of the nuclei? We have looked at the situation as if the nuclei remained fixed. Over a short time span, this would be a good approximation, since the nucleus is so much heavier than an electron. However, over the time span of a macroscopic measurement, this would not be the case. For example, the nuclei in the lattice will be subject to thermal agitation. We may construct a simple model in which these vibrations are harmonic in nature. We can suppose that a lattice behaves as if the bonds act like springs offering resistance to any changes from their natural length.
The potential that a nucleus would experience due to a neighbour would, near the equilibrium position, have the shape shown in Figure 7.
In this model, the nuclei would behave as coupled harmonic oscillators. If energy were added to the system, by heating for instance, then the energy of these oscillators would be changed. Quantum theory can be used to predict what these changes might be. We shall look at this in more detail in Section 4.
2.3 The band theory of solids
Let us now consider what happens to electron energy levels when atoms are brought together to form a crystal.
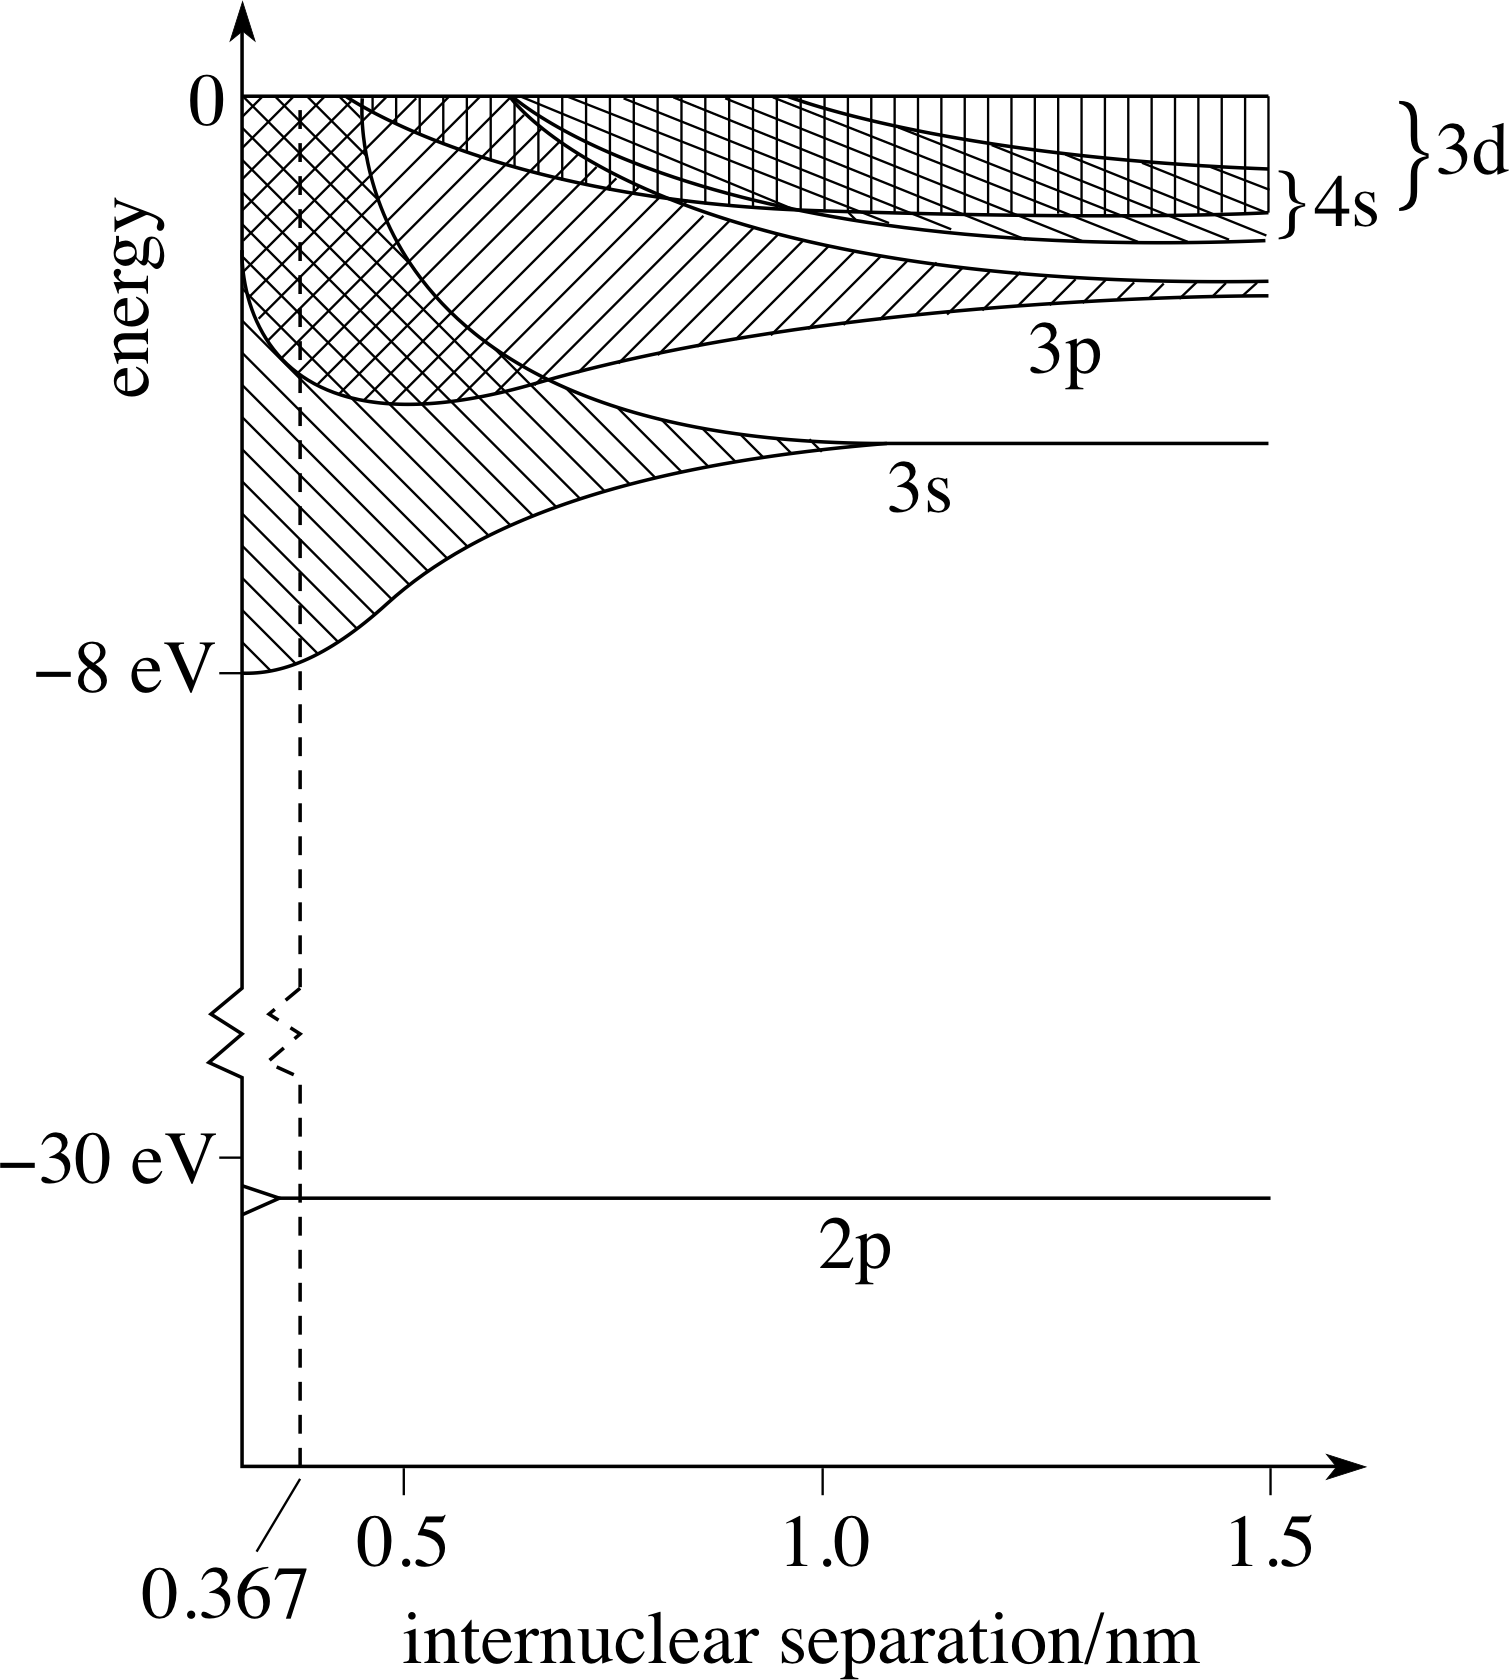
Figure 10 The energy levels of sodium atoms as a function of the internuclear distance.
✦ What happens to the lowest energy levels of a pair of hydrogen atoms as they are brought together?
✧ From Subsection 2.1, we know that they split into two, one corresponding to a symmetric wavefunction and a lower energy than before, and the other with an antisymmetric wavefunction and a higher energy than before.
In the same way, the electron energy levels of the atoms in a crystal, which would have been the same for each atom when the atoms were well separated, will spread out, and since there are so many of them – several for each atom when there are of the order of 1023 atoms – they will be so close together that they will appear to form a continuous energy band. The closer the atoms are to one another, the more marked this effect becomes.
For example, in Figure 10, we show the electronic energy levels of sodium as a function of the internuclear distance in a lattice, a typical band theory calculation. Sodium has eleven electrons, so the 1s, 2s and 2p levels are full. The remaining electron is in the 3s state. The 3p, 3d, 4s etc. levels are empty. As may be seen, at a separation of 1.5 nm, the empty levels are already broadened into bands. The 3d and 4s bands are so broad that they overlap. At about 1 nm, the 3s level starts to broaden. A single electron always goes into the lowest energy level available, to give the most stable configuration.
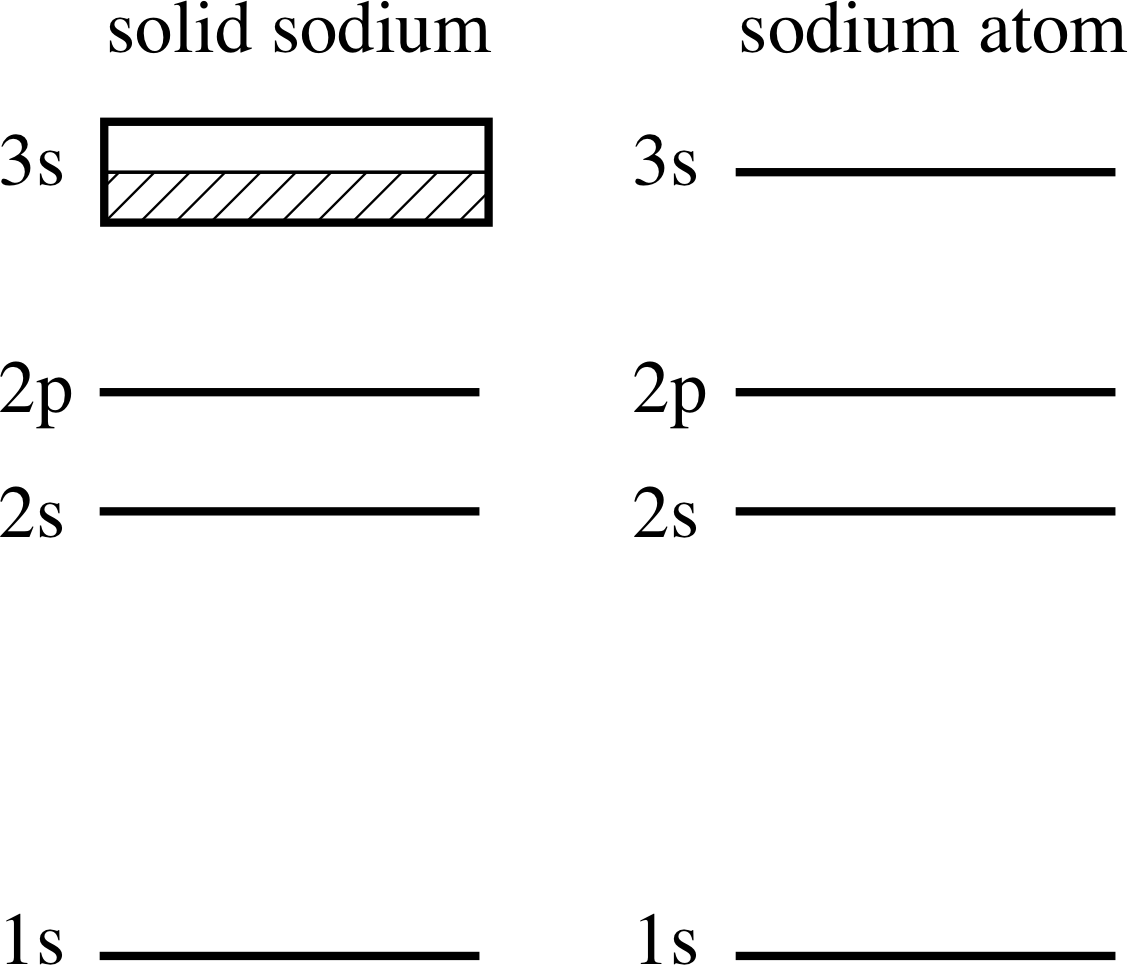
Figure 11 The energy levels of the sodium atom and the corresponding situation in solid sodium. (The diagrams are not drawn to scale.)
By the time the internuclear separation is 0.367 nm, the observed value for solid sodium, the bands are all overlapping, giving a continuous range of energies for the outer electrons ranging from about −8 eV upwards. The last of the inner levels, the 2p level, is still not split.
The electronic configuration of an isolated sodium atom and of sodium atoms in the solid state are compared in Figure 11. In the isolated sodium atom there is a single electron in the 3s outer subshell; this subshell is capable of holding two such electrons and so is half-filled. When sodium atoms are brought together to form solid sodium these 3s levels become the 3s band, which is then half-filled, as shown hatched in in Figure 11. The effect of the proximity of the nuclei on the electron energy levels is the basis of the band theory of solids.
You should not think of a 3s band electron as belonging to any particular sodium atom; as each atom is bound to all its neighbours, a 3s electron can wander over the whole crystal, and can be thought of as being ‘free’ to a first approximation. Furthermore, all electrons are identical, and it is not possible to label one as having come from a particular source. We will not pursue this any further here.
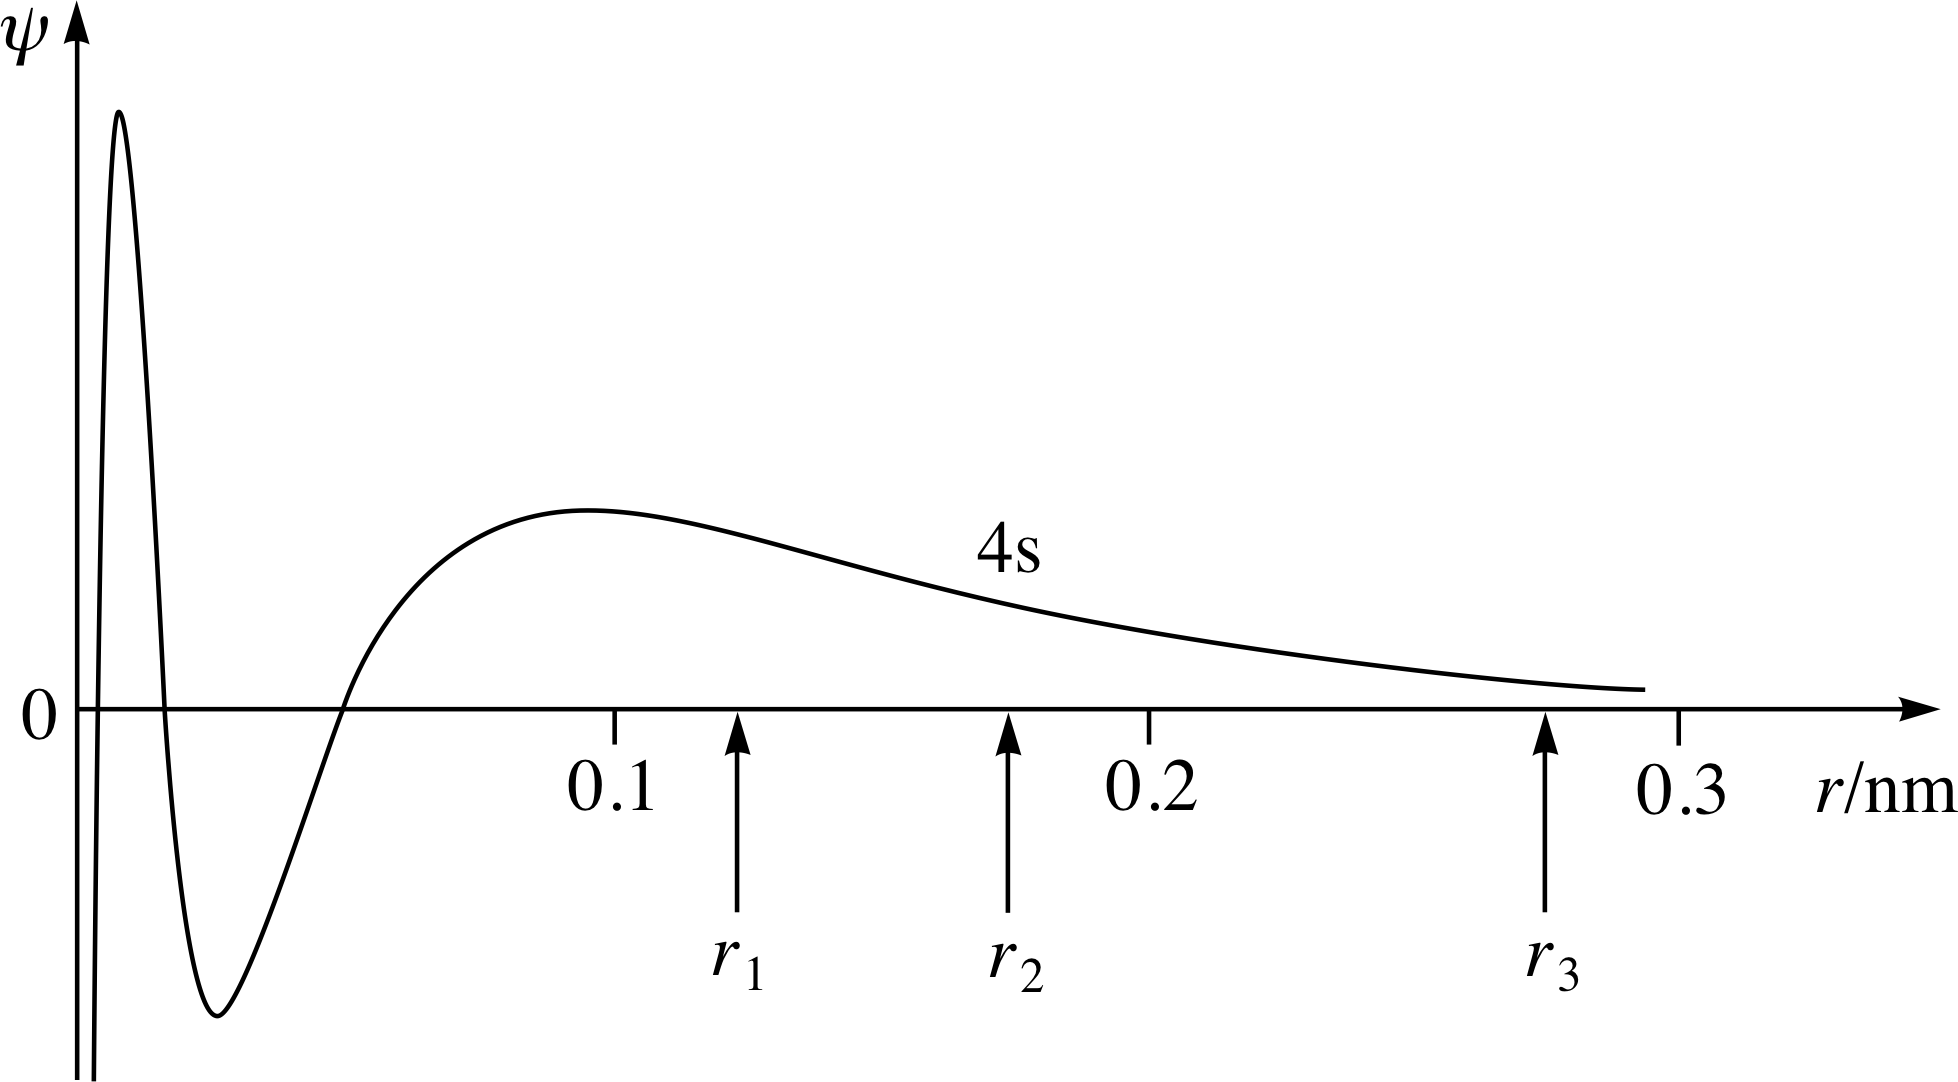
Figure 12 The 4s wavefunction for an isolated nickel atom compared with the distance r1 between any given atom and its nearest neighbour in solid nickel. r2 and r3 are the distances to the second and third nearest neighbours, respectively.
We have simplified the picture so far, to illustrate the ideas involved, by considering only the effect of nearest–neighbour atoms on each other.
In practice, the electrons of one atom will experience the presence of several atoms in its neighbourhood. This is illustrated in Figure 12, in which the 4s spatial wavefunction of an electron in an isolated nickel atom is plotted. It will be seen that the electron’s spatial wavefunction extends so that there is a significant probability of interaction with three nearest neighbour atoms which would be at distances r1, r2, r3 in a nickel crystal. This does not affect the formation of bands of energy levels, but does add to the complexity of deriving them from the appropriate Schrödinger equation.
3 Electrical properties of solids
In this section we look initially at classical accounts of electrical conductivity. We shall then see how quantum mechanics, in the form of band theory, helps us to understand why some solids are conductors and others are not. We shall take as an example the case of a metal. The classical picture of the conduction of electricity in a metal has electrons as carriers of charge. These move in the lattice made up of the positive ions that are left when the carrier electrons are removed. When a potential difference is applied across the solid, the negative electrons are attracted in one direction, the positive ions in the opposite direction. The positive ions are however heavy and bound in the lattice whereas the carrier electrons are light and relatively free. Consequently, only negative charges move; this is the origin of the current that flows. The flow of charge is associated with a change in the average velocity of the electrons.
The flow of electrons is not, however, unimpeded – the electrons will, in the classical picture, collide with the positive ions in the lattice. The electrons will not therefore accelerate indefinitely under the influence of the potential difference. There will be many collisions of different kinds, but there will be an average velocity of progression of the electrons – this is usually called the drift velocity. Thus a steady current is caused. The quantum–mechanical picture includes the wave nature of matter, but it is still the interaction between the electrons and the lattice that is the source of electrical resistance. There is an astonishing feature of the wave nature of matter. If the crystal lattice were perfectly regular, the Schrödinger equation would have a travelling wave solution for the conduction electrons. It is the lattice vibrations that spoil this perfect regularity. This lack of regularity is the origin of electrical resistance.
3.1 Localized and non–localized electrons
The brief outline above shows that the model of conductivity in metals depends on the existence of ‘free’ electrons – or, put another way, electrons that can be given the kinetic energy to move to another part of the solid. In the last section, we looked at the mechanisms whereby atoms are bound together to form a solid. We saw how, in the two instances we looked at, the electronic structure of the atom led to a particular sort of bond.
In the covalent bond, the electrons – in picturesque language – are shared between atoms. These electrons cannot easily be detached from the participating atoms without breaking the bonds and disrupting the lattice. They are localized and cannot contribute to a current. Where the bonds are strong, therefore, such a solid would not be expected to conduct electricity.
With the metallic bond, on the other hand, the highest energy electron is attached only very weakly to any particular atom. These electrons are non-localized. They may be regarded as being shared by all the ions in the lattice. In the absence of a potential difference, however, they move randomly, and there is no a net movement of charge in any direction. However, in the presence of a potential difference, they would be available to contribute to a current. Of course, the lower energy electrons will be localized to the parent atom – for example, the 2p electrons of the metal sodium considered in Section 2.3. The electrons contributing to the current – the conduction electrons – will be relatively small in number compared with the other electrons in the inner shells.
3.2 Electron energy bands and band gaps
We have seen in Section 2 that a characteristic of the energy levels in a solid is that they occur in bands.
Energy bands
The energy levels in a solid form bands of very closely spaced levels. The bands may be separated by relatively large gaps.
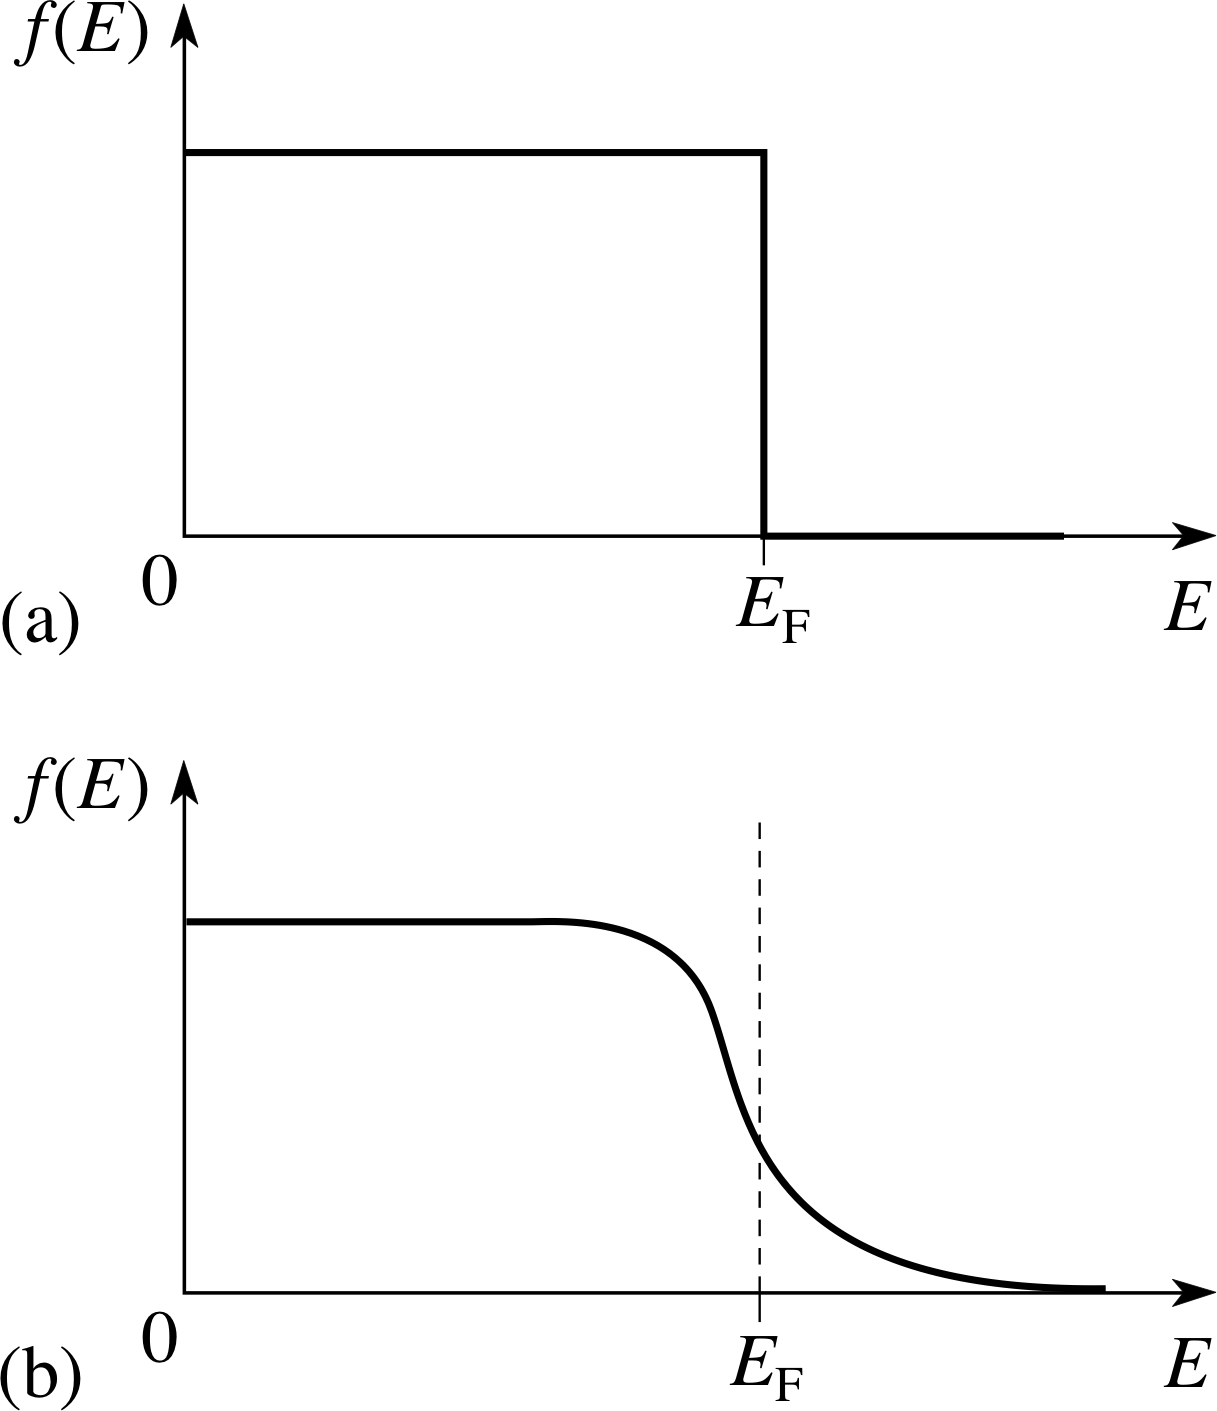
Figure 13 The probability of an electron energy level being filled. (a) The situation at 0 K, (b) at a higher temperature. This distribution is known as the Fermi function.
Because electrons are governed by the Pauli exclusion principle, they cannot all have the lowest energy. They progressively fill the bands, occupying the lowest energy levels available. We will call the highest of the bands that is filled, or substantially filled, the valence band. Higher, but unoccupied, bands are called conduction bands. It is this band structure that determines whether a solid is a conductor, an insulator or a semiconductor. i
For electrical conduction it is necessary for some electrons to be able to gain energy easily from an applied electric field. This cannot happen for the vast majority of electrons, since they are embedded in bands of levels which are completely filled. It is only electrons near the top of the filled levels which may be able to move into unoccupied levels and may therefore contribute to electrical conduction. The electrical properties of a material are thus determined by the band structure near the top of the filled levels.
We can extend this a little by considering the probability of an electron energy level being filled. Figure 13 shows this probability which depends on temperature. In Figure 13a the situation at 0 K is shown and the highest occupied level is EF, the Fermi level. The probability of a level being filled is unity up to this level and zero above it. As the temperature is raised (Figure 13b) some electrons near the top of the distribution move into unoccupied levels above EF, allowing vacancies below EF. It is only these electrons with energy close to EF, which contribute to electron conduction.
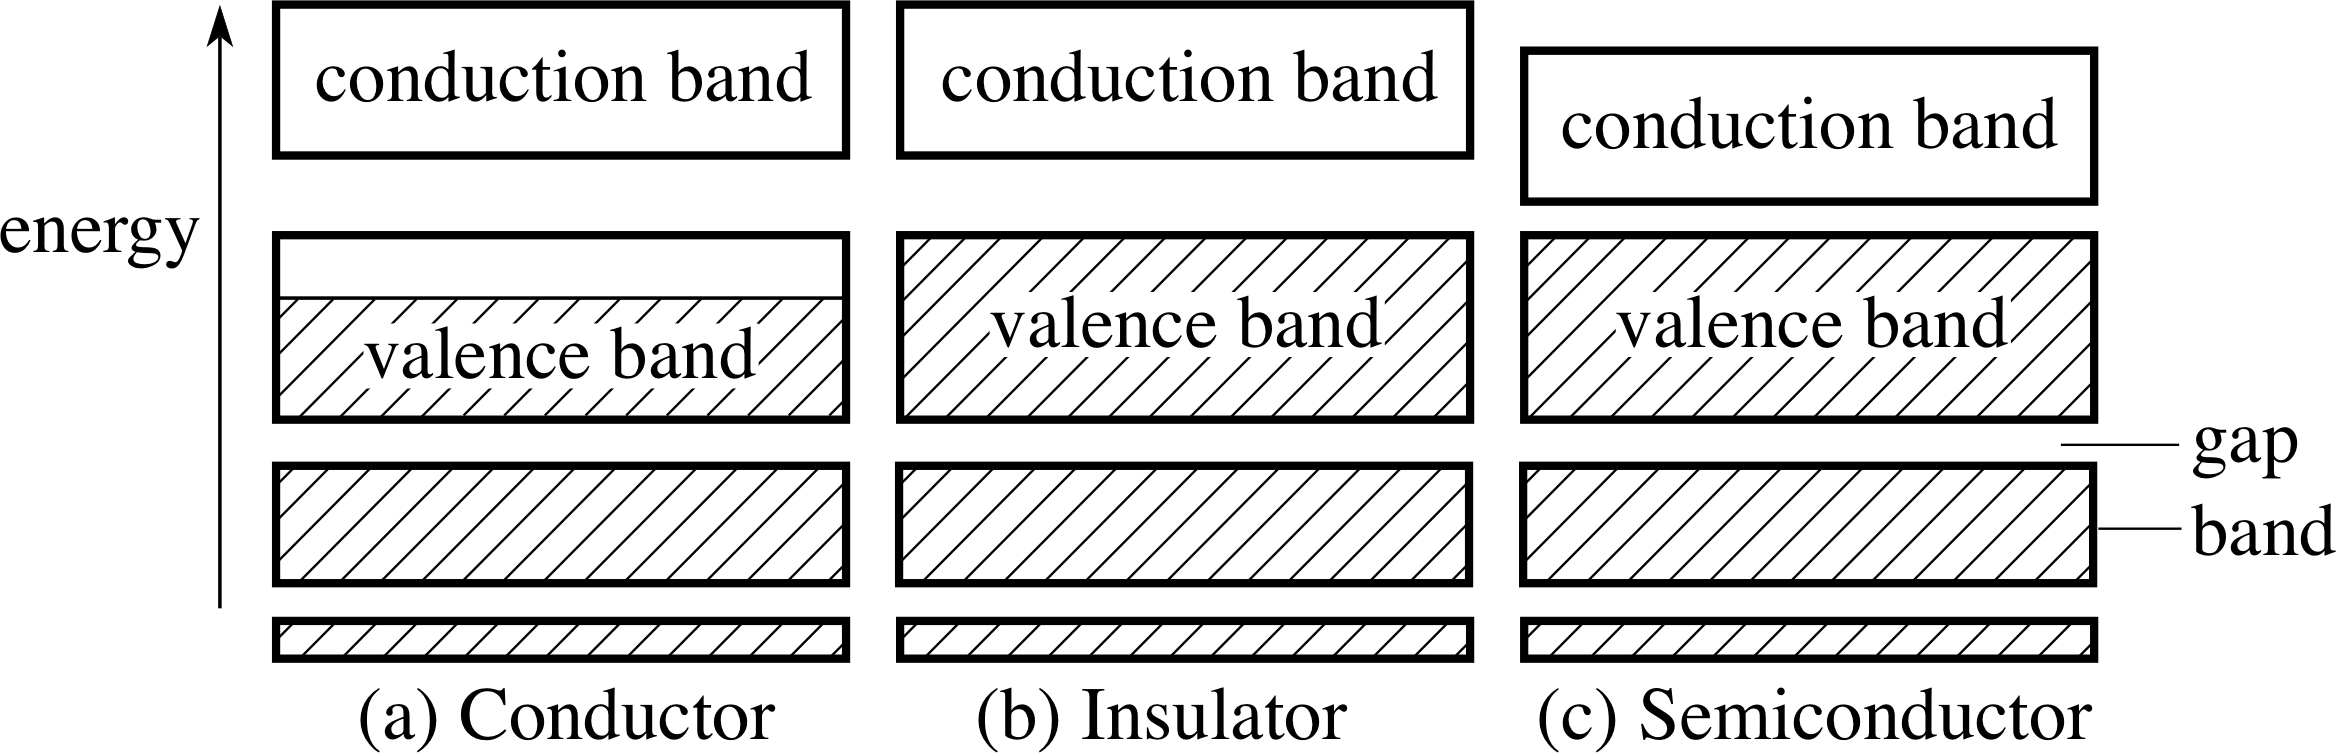
Figure 14 (a) In a metallic conductor, the valence band is only partially filled. (b) In an insulator, the valence band is completely filled. The gap between the valence band and the conduction band is relatively large. (c) In a semiconductor, the valence band resembles that of the insulator but the gap between the valence band and the conduction band is relatively small. (The white boxes represent empty energy levels; the hatched boxes represent occupied energy levels.)
The characteristics of a conductor
Figure 14a shows the band structure in a electrical_conductorconductor. The electrons in a conductor do not fill the valence band but the Fermi level lies within the valence band. In consequence, for the higher energy electrons, there are unfilled energy levels close to the Fermi level that are available to them and to which they can move without violating the Pauli exclusion principle. As a result, when the metal is subjected to a potential difference, the electrons can acquire the kinetic energy associated with a current flow and thus increase their energy. A solid with this band structure will therefore be a conductor.
The characteristics of an insulator
If, on the other hand, we look at Figure 14b, we see that, in this case, the valence band is full. Electrons at the top of the valence band do not have adjacent energy levels. There is a gap (in which there are no allowed energy levels) between the valence band and the next available energy levels in the conduction band. The electrons in a solid with this band occupancy, if subjected to a potential difference, will not be able to increase their energy – there will be no higher energy levels available. The solid can only be an electrical_insulatorinsulator. A typical band gap for an insulator is of the order of 5 eV.
The characteristics of a semi-conductor
Figure 14c shows an intermediate band structure. In this case, the valence band is full – as with the insulator – but now the band gap is much smaller than it was for the insulator. (In silicon, for example, the gap is 1.1 eV.) There will now be a small, but significant, probability that an electron in the valence band will be able to jump to a higher level in the conduction band by thermal agitation. So, in this case, some electrons will be available in the conduction band to take part in a conduction current. i The name semiconductor has been adopted for materials with this band structure. Compared with the metal, however, the number of electrons that can be excited by thermal means will be very small, so that the conductivity will also be correspondingly very much lower than is typical for a metal.
| density of charge carriers, n/m−3 |
resistivity, ρ/Ω m |
conductivity = ρ−1/(Ω m)−1 |
|
|---|---|---|---|
| copper (conductor) | 9 × 1028 | 2 × 10⁻⁸ | 0.5 × 10⁸ |
| silicon (semiconductor) | 1 × 10¹⁶ | 3 × 10³ | 0.3 × 10⁻³ |
Table 1 gives comparative figures for two examples, copper and silicon. The Table illustrates the very large difference between the ability to conduct of the two types of material.
The conductivity of the material as described above is a property of the material in its pure form and it is called intrinsic conduction of the semiconductor.
In practice, the properties of semiconductors are usually controlled by introducing minute quantities of impurity atoms. These will have either one more or one less outer electron than the atoms of the bulk material, and therefore will provide either extra free electrons or leave some levels unfilled creating so–called holes, which can enhance the conductivity of the material. This is known as impurity conduction. Where the impurity added is an electron donor the conduction process takes place effectively with negative charge carriers and the material is said to be an n–type semiconductor. If the impurity added is an electron acceptor the conduction effectively involves the absence of electrons – i.e. the presence of positive holes – and the material is said to be a p–type semiconductor.
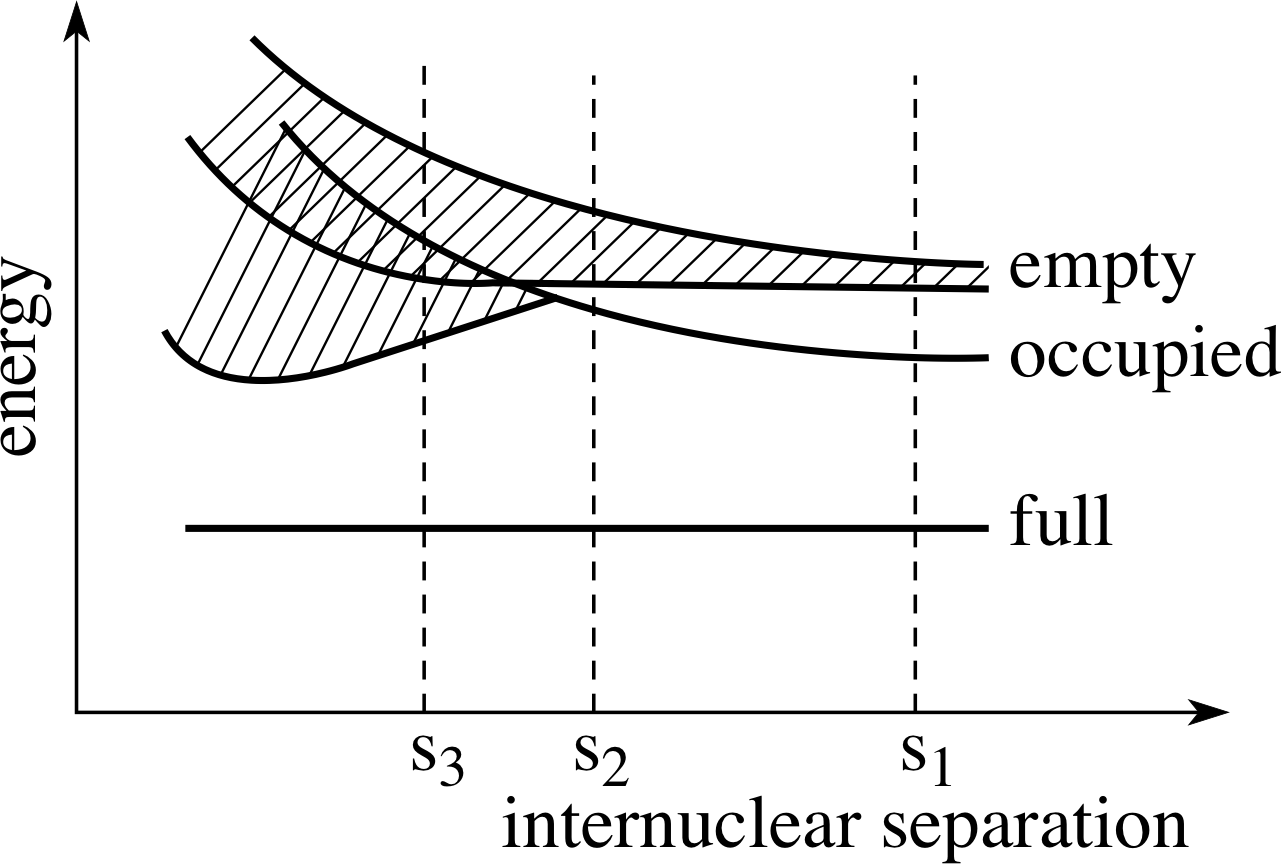
Figure 15 Some of the energy levels of the atoms of an element as a function of the internuclear separation of the atoms. The labels full, occupied and empty refer to the outer electron states in the isolated atoms.
Question T1
Some of the energy levels for the atoms of an element are shown in Figure 15 as a function of the internuclear distance of the atoms. What would you expect the electrical category of the element to be if the equilibrium separation in the solid state were (a) s1, (b) s2 and (c) s3?
Answer T1
(a) With the separation s1, there will be a gap between the highest occupied energy level and the next available level. The solid is most likely to be an insulator.
(b) With the separation s2, there will be a gap, but a much smaller one; the solid might be a semi-conductor.
(c) With the separation s3, there will be no gap; the solid will be a conductor.
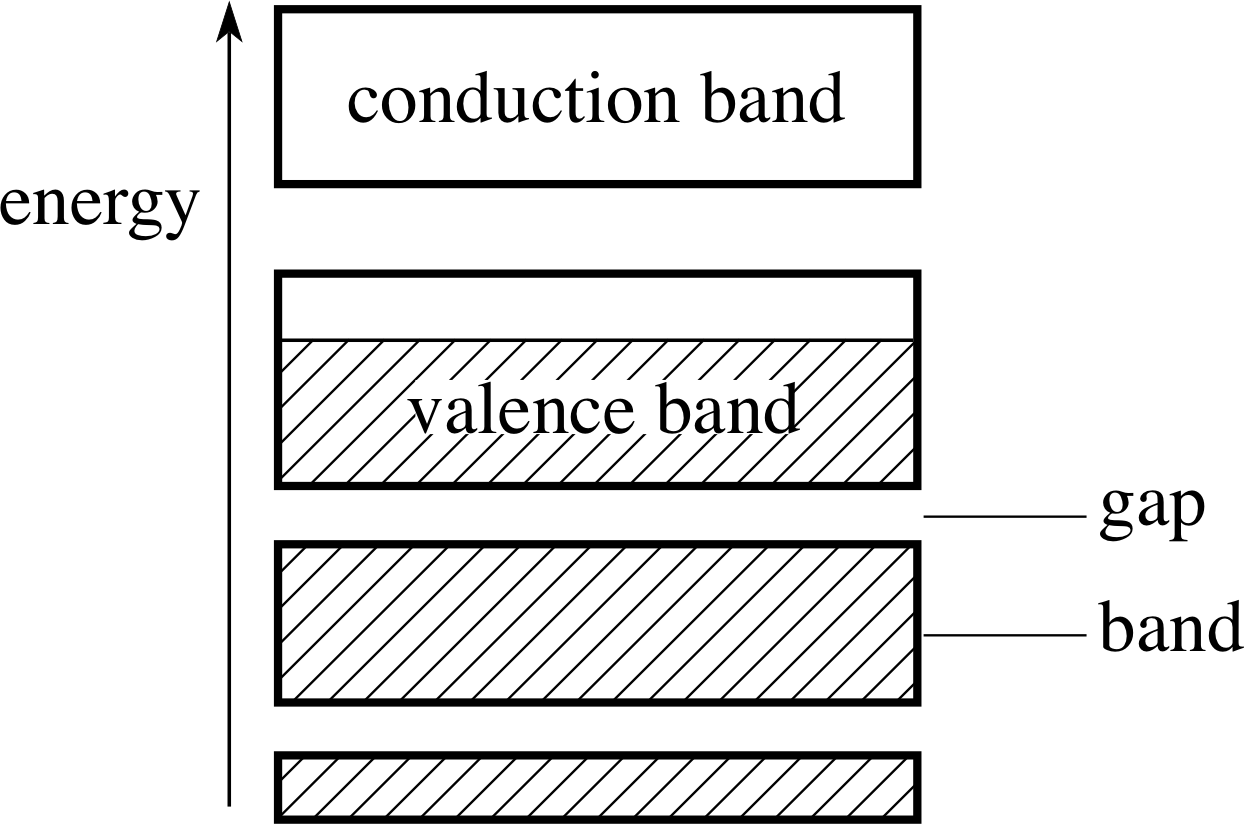
Figure 16 The band diagram for a solid element. The hatched portion corresponds to levels containing electrons.
Question T2
The band structure of a solid is shown in Figure 16.
Explain what happens when a potential difference is applied across a specimen of the solid. Explain your answer with reference to the Pauli exclusion principle.
Answer T2
Electrons obey the Pauli exclusion principle. They may not all occupy the same energy level. When all the states in and below an energy level are occupied, an additional electron may only occupy a higher energy level.
If a potential difference is applied across the solid, the electrons will be subjected to an electric field which, if it were allowed, would increase their energy. Those at the bottom of the valence band, however, will not be able to increase their energy as the levels immediately above them are full (occupied). There are energy states available (empty) immediately above the energy of the most energetic electrons. These electrons do have levels which are not barred to them by the exclusion principle. The most energetic electrons will be able to increase their energy and move in the direction of the applied field.
4 Thermal properties of solids
Figure 7 The energy of the symmetric state of the molecule depends on the separation of the protons. The equilibrium state corresponds to the minimum value of this energy. The anti–symmetric state has higher energy at all separations.
Figure 17 The energy function for the interaction of neighbouring atoms in a crystal lattice. The extent of the oscillation due to thermal energy is shown by x+ and x−.
So far, we have concentrated largely on the properties of the electrons in a solid. We shall now turn to the properties that depend predominantly on the state of the atoms of the solid in the lattice. Let us look first at the effect of temperature on the lattice. In Section 2, we considered the energy of the interaction between atoms in the lattice.
Figure 7 shows the energy function for the protons in the hydrogen molecule. This is the typical shape of the energy graph of the interaction of neighbouring atoms in a lattice. The separation of the atoms where the potential energy function has its minimum value corresponds to stable equilibrium. However, this ignores thermal_kinetic_energythermal energy. Even at room temperature, the atoms will have some thermal energy, so that they will oscillate about the position of equilibrium.
The extent of the oscillation is shown by the range x+ to x− in Figure 17. (The extent of the oscillation is greatly exaggerated, for clarity, in the Figure.) If the temperature is now raised, the thermal energy will increase and as is clear from Figure 17, the amplitude of the oscillation will increase. This is the basic background for a discussion of the effect of temperature on a solid. We shall look at the following: the dependence of electrical conductivity on temperature for conductors and for semiconductors, the specific heat capacity, the thermal expansivity and the thermal conductivity of solids.
4.1 The effect of temperature on electrical conductivity
As we noted in the introduction to Section 3, the resistance to the conduction of electricity in a conductor results from the interaction of the carrier electrons with the atoms in the lattice. As we now see, at a given temperature, the atoms in the lattice are not stationary, but oscillate about their equilibrium positions. When the temperature of the solid is increased, more energy is transferred to the lattice and the amplitude of the oscillation increases. The larger oscillation will mean that the chance of a collision of a conduction electron with a lattice atom must be increased. Consequently, it would be expected that the value of the resistivity should increase with temperature. This is indeed the case for conductors. The increase in resistivity for small increases in temperature is approximately linear. The resistivity, ρ, at temperature T is related to ρ0, the resistivity at temperature T0, by:
ρ = ρ0[1 + α (T − T0)]
The coefficient α is called the temperature coefficient of resistivity. For conductors, this has a positive value which agrees with the model we have proposed above. For copper, it has a value of +4 × 10⁻³ K−1 in the region of room temperature. For conductors, the effect of an increase in temperature on the number of conduction electrons is very small. So we ignore this entirely.
| n | ρ | α | |
|---|---|---|---|
| conductor | high | low | positive |
| semiconductor | low | high | negative |
However, for intrinsic conduction semiconductors, the situation is very different. The existence of this conductivity depends on the thermal agitation, which causes electrons in the valence band to jump in energy into the conduction band. When the temperature is raised, therefore, and the thermal energy available is increased, the number of electrons reaching the conduction band will be greater. So, with the increase in the number of charge carriers, the resistivity of the semiconductor will decrease. Opposing this will be the effect of the increased lattice vibrations – as for the metal – but this is a relatively small effect; the coefficient α for a semiconductor is therefore negative. The value for silicon, for instance, is −70 × 10−3 K−1 in the region of room temperature (the effect is not linear over a large temperature range). Table 2 highlights the very distinctive properties of conductors relative to semiconductors.
4.2 The specific heat capacity of a solid
The specific heat capacity of a material is a measure of the heat required to raise its temperature. More precisely, it is the heat required to raise one mole through one kelvin. In SI units, it is therefore measured in J mol−1 K−1. i At the atomic level, the heat is communicated as energy to the atoms in the lattice, and in the case of a conductor, to the ‘free’ electrons. Except for conductors at very low temperatures, the thermal energy stored within a solid is predominantly in the oscillations in the lattice.
Classical theory predicts that the specific heat capacity of a crystal should be the same at all temperatures. However, experimentally it is found that for all solids, the specific heat tends to zero as the temperature approaches absolute zero, although the classical value is correct at high temperatures. Einstein proposed a quantum mechanical model to explain this behaviour, based on two simple assumptions:
- The atoms behave as quantum harmonic oscillators. i
- Although the lattice is in fact many oscillators coupled together, there is effectively a single frequency of oscillation fE, that applies to each oscillator independently.
From the quantum theory of the harmonic oscillator it then follows that each atom has the following energy levels associated with its thermal agitation:
$E_n = \left(n + \frac12\right)hf_E$ with n = 0, 1, 2, 3, ...
At very low temperatures, there will not be enough thermal energy to excite any of the oscillators from its lowest state, so the solid can be heated without any energy being contributed to the excitation of the lattice. In other words, the specific heat will be very small at low temperatures. Only when one reaches higher temperatures, when the thermal_kinetic_energythermal energy kT is comparable with the separation of the oscillator levels, hfE, will there be significant excitation of the oscillators, and a significant amount of energy required to increase the temperature of the crystal.
This Einstein model was qualitatively correct, but was made quantitatively correct by a modification due to Debye. i Debye dropped the second assumption above, and replaced it with a more realistic distribution of frequencies arising from the fact that the oscillators are not independent but coupled. This refinement then gives the correct dependence of the specific heat C on temperature near absolute zero: C ∝ T 3. The Debye model, although very important, is a relatively minor step compared with the revolutionary step taken by Einstein in using quantized energy levels. The classical model, which has a continuous energy spectrum, leads to a totally wrong prediction of the behaviour of solids at low temperatures.
The Debye model is very good for insulators. For conductors at room temperature, it also fits experimental values well, but falls down near absolute zero.
The reason for this is the neglect of the energy that will be communicated to the conduction electrons. These are essentially free and do not take part in the lattice vibrations. This is not serious at room temperature when the lattice energy is very much larger than the free electron energy. However, at very low temperatures, the lattice energy becomes very much smaller and the electron energy can no longer be neglected.
With its inclusion into the Debye model, a contribution to C proportional to the temperature is added to the lattice contribution. The new prediction, C = AT 3 + BT, where A and B are constants, closely fits experimental results for conductors.
What do these results tell us about the atomic lattice?
Both models assume that the lattice oscillations are harmonic. The potential energy function for a simple harmonic oscillator is parabolic: $U_{\rm SHO}(x) = \frac12kx^2$. For small oscillations near a minimum in the energy curve, a parabola is a good approximation to the curve. [Remember that in Figure 17 the thermal oscillation was greatly exaggerated for visibility on the graph.]
The success of the Debye model shows that only small oscillations need be considered in practice.
| T/K | C/mJ mol−1 K−1 |
|---|---|
| 5 | 20.8 |
| 10 | 61.4 |
| 15 | 142 |
| 20 | 281 |
| 25 | 499 |
Question T3
The specific heat capacity C for a solid depends on temperature T as shown in Table 3. Plot a graph of C/T against T 2.
Is the solid a conductor or an insulator?
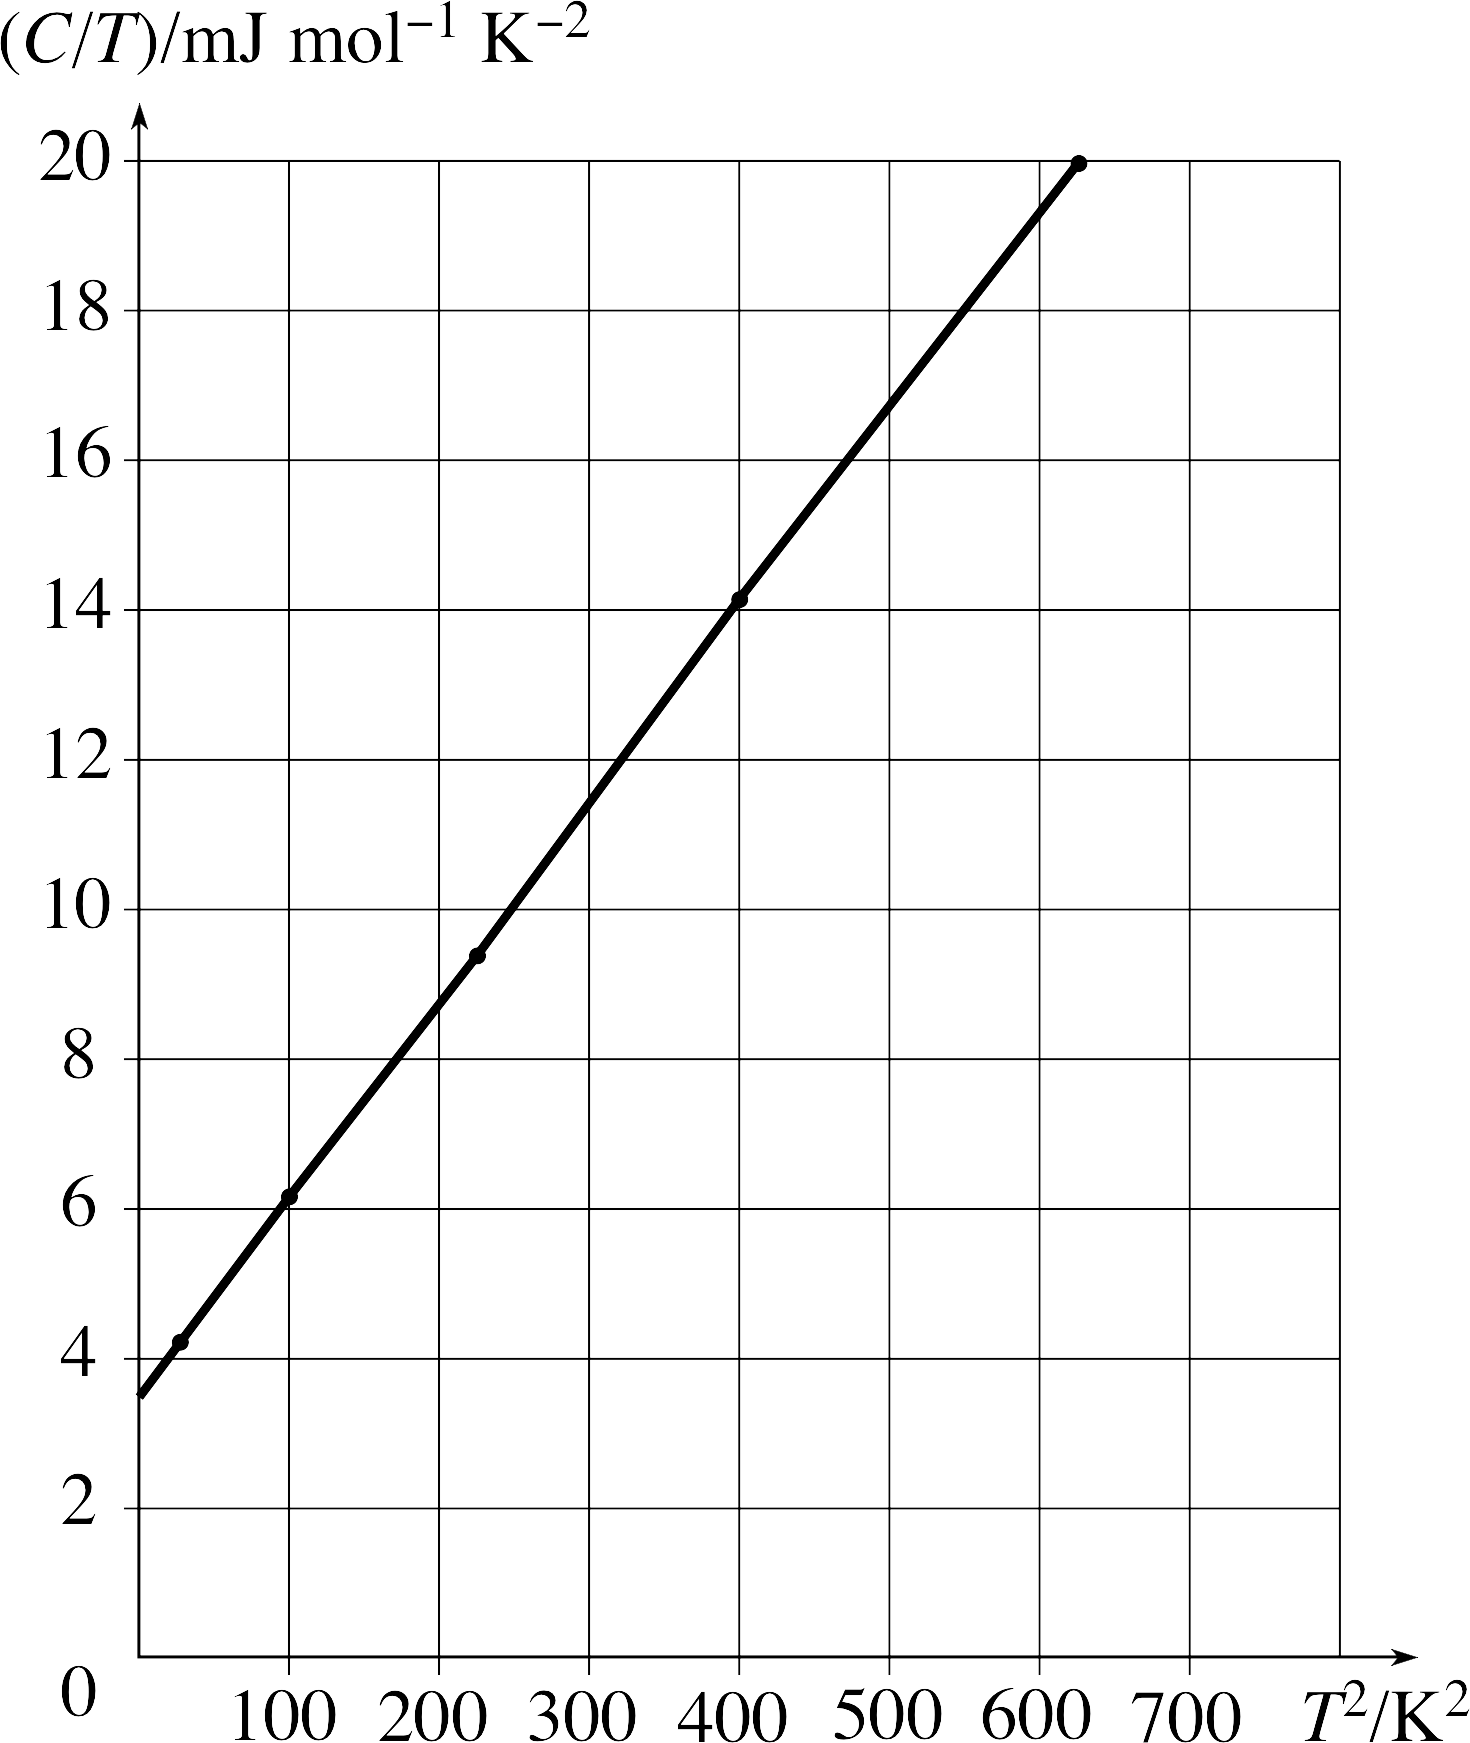
Figure 20 See Answer T3.
Answer T3
| C/T/mJ mol−1 K−2 | T2/K2 |
|---|---|
| 20.8 | 25 |
| 61.4 | 100 |
| 142 | 225 |
| 281 | 400 |
| 499 | 625 |
Table 5 shows the values of C/T and T2 that are plotted in Figure 20. The graph is a reasonable straight line.
Since C = AT3 + BT for a conductor, we expect that C/T = AT2 + B, where B is a measure of the electron contribution.
The graph is of this form and it does not go through the origin, showing that the solid is a conductor with a contribution to the heat capacity from the conduction electrons.
4.3 The thermal expansivity of a solid
A property which illustrates another feature of the potential is the thermal expansivity. When a solid is heated, it expands in volume. This is wholly a property arising from the effect on the lattice. The increase in volume arises because the atoms in the lattice move further apart as the temperature rises. Let us look again at the energy function to see how this may happen. In Figure 18, we show the oscillation of the lattice at a given temperature (and energy) E1. At a higher temperature, the lattice oscillation will have a higher energy, E2, and consequently a larger amplitude. If the shape of the potential around the equilibrium point were parabolic – that is symmetrical about the equilibrium position – then the centre of oscillation X would not change. In this case, the solid should not be expected to expand with increased temperature.
Figure 18 Thermal oscillation at energy E1 is centred on X. If the shape of the energy curve is not symmetrical about the equilibrium position, the thermal oscillation at energy E2 is centred on a different point Y.
Figure 18 shows, however, a potential that is not symmetrical about the equilibrium point. In this case, with E1 < E2 and the shape of potential shown, we see that the new centre of oscillation Y is at an increased separation at the higher temperature. The solid will expand when heated. Thus, an external observation gives a clue about the shape of the potential energy of the microscopic interaction.
Remember, however, that the specific heat capacity was explained, in the simplest theories, by the assumption that the thermal vibrations of the lattice were simple harmonic. For this to be the case, the potential must be parabolic – the potential energy function of a simple harmonic oscillator is given by:
$U_{\rm SHO}(x) = \frac12kx^2$
Thus, a more complete theory of specific heat capacity should also allow for the so–called anharmonic effects, however small these might be in practice. We shall not pursue that further here; we only wish to demonstrate the importance, in the development of any theory (in this case of the solid state), of considering more than one measurable quantity. Degree courses may be divided up, for convenience of teaching and learning, into segments labelled electricity, heat, and so forth, but the laws of nature transcend such artificial constraints.
4.4 The thermal conductivity of a solid
If one end of a solid bar is raised to a higher temperature than the other end, heat will flow from the end at the higher temperature to the end at the lower temperature. The property of a material which determines the rate of this process is called its thermal conductivity. On the atomic scale, this can be understood as the transmission of energy between the atomic oscillators in the lattice. As one end is heated to raise its temperature, the oscillators at that end will vibrate more vigorously and in doing so will cause their neighbouring atoms to oscillate more vigorously. This effect of atoms on their interacting neighbours will apply all the way down the bar.
The thermal conductivity is measured macroscopically by the coefficient of thermal conductivity κ, which we shall now define. Suppose that a bar of length l and constant cross section A has its ends maintained at temperatures T1 and T2. The rate of flow of heat H down the bar, assuming no heat escapes laterally is given by:
$\dfrac{dQ}{dt} = -\kappa A \dfrac{T_2 - T_1}{l}$
The larger the value of κ for a solid, the better the solid conducts heat.
| κ /W m−1 K−1 | σ /Ω−1 m−1 | |
|---|---|---|
| silver | 428 | 0.62 × 10⁸ |
| copper | 401 | 0.59 × 10⁸ |
| aluminium | 235 | 0.36 × 10⁸ |
| silicon | 168 | 0.3 × 10⁻³ |
| glass | ≈ 1 | ≈ 10−12 |
Some values of κ are given in Table 4.
You will note that there is a marked correlation between the ability of a substance to conduct electricity and its ability to conduct heat. This is an indication that the conduction electrons, as well as the lattice vibrations, play a role in the conduction of heat energy. This is noticeable because, although the energy of the atoms vibrating in the lattice is relatively large, only small amounts of this energy are communicated to neighbours and so contribute to the conduction of heat. On the other hand, the conduction electrons have relatively small energies, but especially in metals, can transmit energy much more easily since they are mobile.
5 Closing items
5.1 Module summary
- 1
- The atoms of an element in a solid crystalline structurecrystalline solid are arranged in a regular array that may be characterized by a lattice of points.
- 2
- The atoms are held in the array by interatomic bondbonds.
- 3
- The nature of the bond depends on the electronic structure of the atom.
- 4
- The energy levels of the electrons in an isolated atom always broaden when atoms are in close proximity. In the stable crystalline configuration, the energy levels become continuous energy bandenergy bands with Section_3.2gaps containing no energy levels between the bands.
- 5
- A solid is a conductor of electricity if its electrons only partly fill an energy band. It is an insulator if the electrons completely fill a band and there is a large gap to the next empty band above the filled band.
- 6
- If the electrons of a solid completely fill an energy band, but the gap above this band is narrow enough to allow thermally excited electrons to jump across it, the solid is a semiconductor. Such gaps must be larger than about 1 eV.
- 7
- The temperature coefficient of resistivity α is positive for a conductor but negative for a semiconductor.
- 8
- The specific heat capacity of a solid insulator may be accounted for in terms of the quantum theory of the harmonic oscillations of the atoms in the lattice.
- 9
- The specific heat capacity of a conductor is explained by the same theory except at very low temperatures, near absolute zero, where the contribution from the energy of the Section_4.2conduction electrons becomes significant.
- 10
- The Section_4.3thermal expansivity of a solid provides evidence that the curve of interaction energy against separation for the atoms in the lattice is not quite symmetrical about the minimum.
- 11
- Conduction electrons contribute to the high Section_4.4thermal conductivity of electrical conductors. In an insulator, only the interaction of the atoms with their neighbours is available as a means of propagating thermal energy.
5.2 Achievements
Having completed this module, you should be able to:
- A1
-
Define the terms that are emboldened and flagged in the margins of the module.
- A2
-
Give a qualitative description of the broadening of electronic energy levels when atoms are brought close to each other.
- A3
-
Given an energy band diagram of a solid, say whether the solid is an insulator, a conductor or a semiconductor, and justify your choice.
- A4
-
Explain why the density of electrical carriers in a conductor is very much larger than in a semiconductor.
- A5
-
Explain why the temperature coefficient of resistivity of a conductor is positive, while that for a semiconductor is negative.
- A6
-
Relate the thermal expansivity of a solid to the shape of the interaction energy against separation curve for the atoms in the crystal lattice.
- A7
-
Explain why good electrical conductors are also good thermal conductors.
Study comment You may now wish to take the Exit test for this module which tests these Achievements. If you prefer to study the module further before taking this test then return to the topModule contents to review some of the topics.
5.3 Exit test
Study comment Having completed this module, you should be able to answer the following questions each of which tests one or more of the Achievements.
Question E1 (A2)
Describe the effect on the energy levels of isolated atoms of bringing the atoms closer to each other as in a solid element.
Figure 10 The energy levels of sodium atoms as a function of the internuclear distance.
Answer E1
The electrons in isolated atoms occupy discrete energy levels. The energy levels are degenerate; they may each contain more than one electron provided those electrons are in different states, characterized by different values of the various quantum numbers. The theoretical energy levels are found by solving the Schrödinger equation for the atom in question.
When a solid is formed of many atoms, the energy levels that are available for the electrons are influenced by the presence of the other atoms near the ‘parent’ atom of each electron if we consider how a solid may, hypothetically, be formed. The effect this has on the energy states available to electrons in the solid is shown in Figure 10. As the atoms are brought closer together, the degeneracy of the energy levels is broken starting with the higher levels, but, as the separation is reduced, progressing to lower and lower levels. Each level spreads and becomes many closely spaced levels. These eventually overlap to give energy bands – many levels so close together as to be considered as a continuous range.
(Reread Section 2 if you had difficulty with this question.)
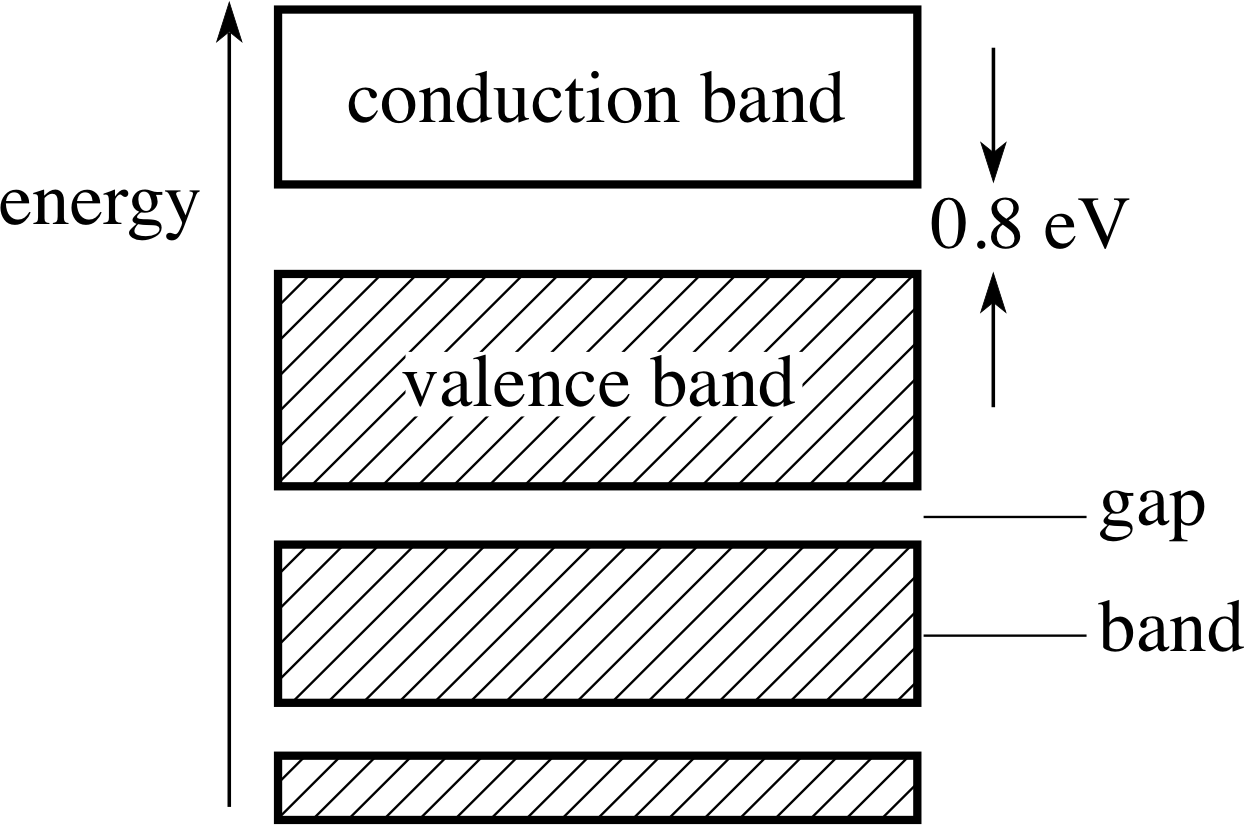
Figure 19 See Question E2.
Question E2 (A3)
Figure 19 shows the energy band diagram for a solid element. Is the element a conductor, an insulator or a semiconductor of electricity? Give the reason for your answer.
Answer E2
The energy band diagram shows a full valence band, but a gap to the conduction band of only 0.8 eV. The electrons at the top of the valence band will not be able to increase their energies to become part of a current of electrons if a potential difference is applied to the solid. However, the band gap is so small that there will be a probability – although a small one – that electrons at the top of the valence band will be able to acquire energy for transition to the conduction band by thermal agitation. These electrons will be available for conduction. The number density of electrons in the conduction band will be very small in comparison with a metal, so the conductivity will be correspondingly very much lower. The solid is a semi-conductor.
(Reread Section 3 if you had difficulty with this question.)
Question E3 (A4 and A5)
The density of electrical carriers in a conductor is very much greater than in a semiconductor. The temperature coefficient of resistivity of a conductor is positive, while that for a semiconductor is negative. How are these two statements connected?
Answer E3
Figure 14 (a) In a metallic conductor, the valence band is only partially filled. (b) In an insulator, the valence band is completely filled. The gap between the valence band and the conduction band is relatively large. (c) In a semiconductor, the valence band resembles that of the insulator but the gap between the valence band and the conduction band is relatively small. (The white boxes represent empty energy levels; the hatched boxes represent occupied energy levels.)
In both conductors and semi-conductors, electrons may take part in a conduction current because there are accessible energy levels. In the case of the conductor, these electrons are very large in number since the valence energy band is not full (see Figure 14). In the case of the semiconductor the electrons that are available for conduction are those that can jump the energy gap using thermal energy. These are, relatively, very few in number and so the density of conduction electrons is much lower than is the case in the conductor.
However, when the temperature is increased, the number of electrons available for conduction will increase for the semi-conductor. This will tend to increase the conductivity (i.e. decrease the resistivity). The inhibiting effect of the increased lattice vibrations is not sufficient to outweigh the increase, so the net effect will be a negative temperature coefficient of resistivity. In the case of the conductor, there is only the latter inhibiting effect of the lattice; the resistivity increases with temperature and the temperature coefficient is positive.
(Reread Subsection 4.1 if you had difficulty with this question.)
Question E4 (A6 and A7)
Sketch the curve for the energy of interaction between neighbouring atoms and their internuclear separation. If the solid is an insulator, what features of the shape of the curve determine: (a) the quantum model that will be used to describe the specific heat capacity of the solid, and (b) the thermal expansivity of the solid?
What other factor enters the model of the specific heat capacity if the solid is an electrical conductor?
Answer E4
Figure 2 The energy of interaction between two atoms.
Figure 17 The energy function for the interaction of neighbouring atoms in a crystal lattice. The extent of the oscillation due to thermal energy is shown by x+ and x−.
A typical interaction curve is shown in Figure 2.
(a) If the solid is an insulator, the effect of increasing the temperature of the solid will be to increase the thermal energy of oscillation of the atoms in the lattice. The extent of thermal oscillation is illustrated in Figure 17 by the range x+ to x−.
If the shape of the interaction energy curve is symmetrical about the equilibrium position x, the oscillations will be harmonic, and the quantum–mechanical model will be the quantum harmonic oscillator which has a positive integer quantum number n and energy values $E_n = \left(n +\frac12\right)hf$, where f is the frequency of the oscillation.
Figure 18 Thermal oscillation at energy E1 is centred on X. If the shape of the energy curve is not symmetrical about the equilibrium position, the thermal oscillation at energy E2 is centred on a different point Y.
(b) The expansivity of a solid with temperature depends on the shape of the interaction energy not being symmetrical about the 0 K equilibrium position. If this is the case, as the thermal energy increases, then the mean separation of the thermally agitated atoms will change (as shown in Figure 18 by the movement from X to Y).
If the solid is an electrical conductor, then, as the temperature is increased, energy is also imparted to the conduction electrons. This effect is only appreciable near to absolute zero.
(Reread Subsections 4.2 and 4.3 if you had difficulty with this question.)
Question E5 (A8)
Why are good electrical conductors generally also good thermal conductors?
Answer E5
Electrical conduction depends on a ready supply of conduction electrons.
Thermal conductivity for an insulator can only take place through the interaction of neighbouring atoms with each other. The atoms at the high temperature end of a bar of a solid will have greater thermal oscillations than their neighbours nearer to the low temperature end. The atoms interact with their neighbours so some of the energy will be passed to the less excited neighbours, who in turn pass on energy to their less excited neighbours and so on. By this means (thermal) energy is transmitted down the bar.
In the case of a conductor, there is a second mechanism for transmitting energy through the mobile conduction electrons. This second mechanism explains why electrical conductors are also generally better thermal conductors than are electrical insulators.
(Reread Subsection 4.4 if you had difficulty with this question.)
Study comment This is the final Exit test question. When you have completed the Exit test go back and try the Subsection 1.2Fast track questions if you have not already done so.
If you have completed both the Fast track questions and the Exit test, then you have finished the module and may leave it here.
Study comment Having seen the Fast track questions you may feel that it would be wiser to follow the normal route through the module and to proceed directly to the Subsection 1.3Ready to study? Subsection.
Alternatively, you may still be sufficiently comfortable with the material covered by the module to proceed directly to the Section 5Closing items.