PHYS 5.7: Sound – a wave phenomenon |
PPLATO @ | |||||
PPLATO / FLAP (Flexible Learning Approach To Physics) |
||||||
|
1 Opening items
1.1 Module introduction
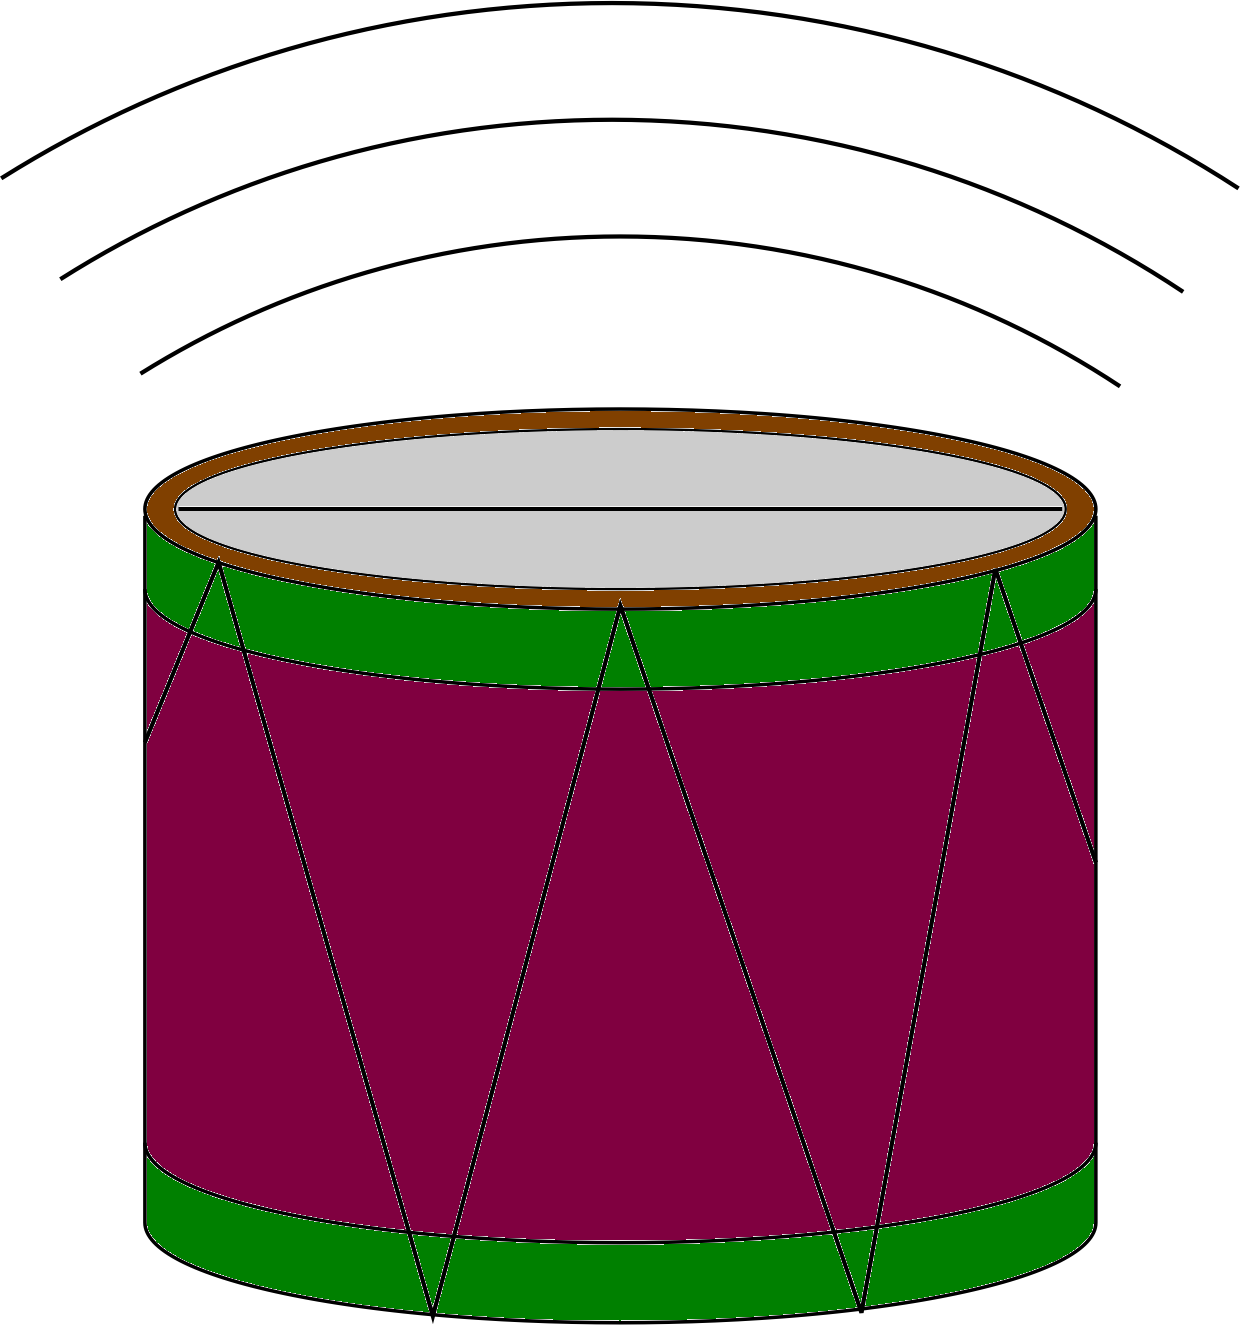
Figure 1 The creation of a sound wave.
Sounds are made when objects vibrate. The vibrations of the drum skin in Figure 1, for example, will cause the air above the drum to move back and forth, thus creating pressure waves that can travel through the surrounding air. It is these pressure waves that constitute the sound produced by the drum. When the pressure waves arrive at the human ear they cause the vibration of various membranes and bones which in turn activate sensory organs inside the ear that send nerve impulses to the brain. Hearing is a mental phenomenon, influenced by physiological and psychological factors that are still not fully understood, but sound is a purely physical phenomenon, and therefore a very suitable topic for a FLAP module.
Section 2 explores the nature and characteristics of sound waves. It explains what is meant by a longitudinal wave and lists the properties such as wavelength and frequency that may be used to characterize such a wave.
It also investigates the physical properties of a medium that determine the speed at which sound will propagate, and examines the way in which the properties of sound waves change as they travel from one medium to another. Section 3 concerns the Doppler effect: the dependence of the observed frequency of a sound wave on the relative motion of the sound source and the observer. Section 4 concerns reflection and refraction of sound, and explains how these simple phenomena can be put to practical use in medical and other applications. Section 5 deals with the energy transported by sound waves. It introduces the related concepts of intensity and intensity level and discusses the measurement of the latter in terms of decibels. Finally, Section 6 shows how the superposition principle can be applied in the case of sound to account for such typical wave phenomena as interference and diffraction. This final section also contains a few brief references to the nature of musical sounds.
Study comment Having read the introduction you may feel that you are already familiar with the material covered by this module and that you do not need to study it. If so, try the following Fast track questions. If not, proceed directly to the Subsection 1.3Ready to study? Subsection.
1.2 Fast track questions
Study comment Can you answer the following Fast track questions? If you answer the questions successfully you need only glance through the module before looking at the Subsection 7.1Module summary and the Subsection 7.2Achievements. If you are sure that you can meet each of these achievements, try the Subsection 7.3Exit test. If you have difficulty with only one or two of the questions you should follow the guidance given in the answers and read the relevant parts of the module. However, if you have difficulty with more than two of the Exit questions you are strongly advised to study the whole module.
Question F1
The speed of sound in iron is 5130 m s−1. If the density of iron is 7860 kg m−3, what is the value of the Young modulus for iron?
Answer F1
For iron, the speed of sound υ = 5130 m s−1 and the density ρ = 7860 kg m−2.
The speed of sound υ in a solid is given by:
$\upsilon = \sqrt{\dfrac{Y\os}{\rho}}$
where Y is Young’s modulus.
ThereforeY = υ2ρ
soY = (5130 m s−1)2 × 7860 kg m−3 = 2.1 × 10¹¹ N m−2 (or Pa)
Question F2
A fire engine is travelling directly towards an observer at a speed of 108 km h−1 whilst sounding its siren. The frequency of the siren, measured in the cab of the fire engine, is 2 kHz and the speed of sound in air is 340 m s−1. What is the frequency of the siren as measured by the (stationary) observer?
Answer F2
We need to use the Doppler effect equation applicable to the case of a moving source of sound:
$f_{\rm obs} = f_{\rm source}\left[\dfrac{1}{1-\left(\left.\upsilon_{\rm source}\,\middle/\upsilon_{\rm sound}\right.\right)}\right]$
where the speed of the source (the fire engine) υsource = 108 km h22 = 30 m s−2, the speed of sound υsound = 340 m s−2 and the frequency at the source (in the cab) fsource = 2 kHz. Hence the frequency measured by the observer is:
$f_{\rm obs} = \rm (2\,kHz)\times\left[\dfrac{1}{1-\left(\left.30\,m\,s^{-1}\middle/340\,m\,s^{-1}\right.\right)}\right] = (2\,kHz)\times\left(\dfrac{1}{1-0.09}\right) = 2.2\,kHz$
So the frequency of the siren measured by the stationary observer is higher than that measured in the cab of the fire engine.
Question F3
Describe two applications of the reflection of ultrasound.
Answer F3
Bats emit short bursts of ultrasound and detect the echoes produced by the reflection of the ultrasound off solid objects. Thus they have an echo–location system which enables them to determine the distances to the objects. A second example of the application of ultrasound reflection is the production of images of the foetus in pregnant women. Other examples of ultrasonic echo–location include seismic surveying and the detection of cracks in metals.
Question F4
The speed of sound is 340 m s−1 in air, and 5100 m s−1 in aluminium. From these data, calculate the critical angle of incidence at an air–aluminium boundary.
Answer F4
The speed of sound in air, υair = 340 m s−1 and the speed of sound in aluminium, υal = 5100 m s−2. Applying Snell’s law we find:
$\sin\theta_{\rm c} = \dfrac{\upsilon_{\rm air}}{\upsilon_{\rm al}} = \rm \dfrac{340\,m\,s^{-1}}{5100\,m\,s^{-1}} = 0.0667$
Thereforeθc = 3.82°.
1.3 Ready to study?
Study comment In order to study this module you will need to be familiar with the following terms: density, displacement, distance, energy (kinetic_energykinetic and potential_energypotential), force, position, power and speed. The level of knowledge required in each case is not particularly high since the module is largely introductory. However, it would certainly be an advantage to have met the basic concepts of oscillations and waves before, whatever the context. It is also assumed that you are conversant with SI units and familiar in general terms with pressure and temperature. (Pressure is particularly important in this module and is the subject of a special note when it first arises in the main text.) From a mathematical point of view you should be able to rearrange simple equations, evaluate expressions (using a calculator when appropriate) and have some familiarity with simple trigonometric functions, particularly sin x. In Subsection 5.2 you will also be require to use logarithms (log10 x) and antilogarithmic_functionantilogarithms. If you are unsure about any of these terms you should refer to the Glossary, which will also indicate where in FLAP they are developed. The following Ready to study questions will allow you to establish whether you need to review some of these topics before embarking on this module.
Question R1
Sketch a graph of the sine of an angle against the size of the angle in degrees, for angles between 0° and 360°.
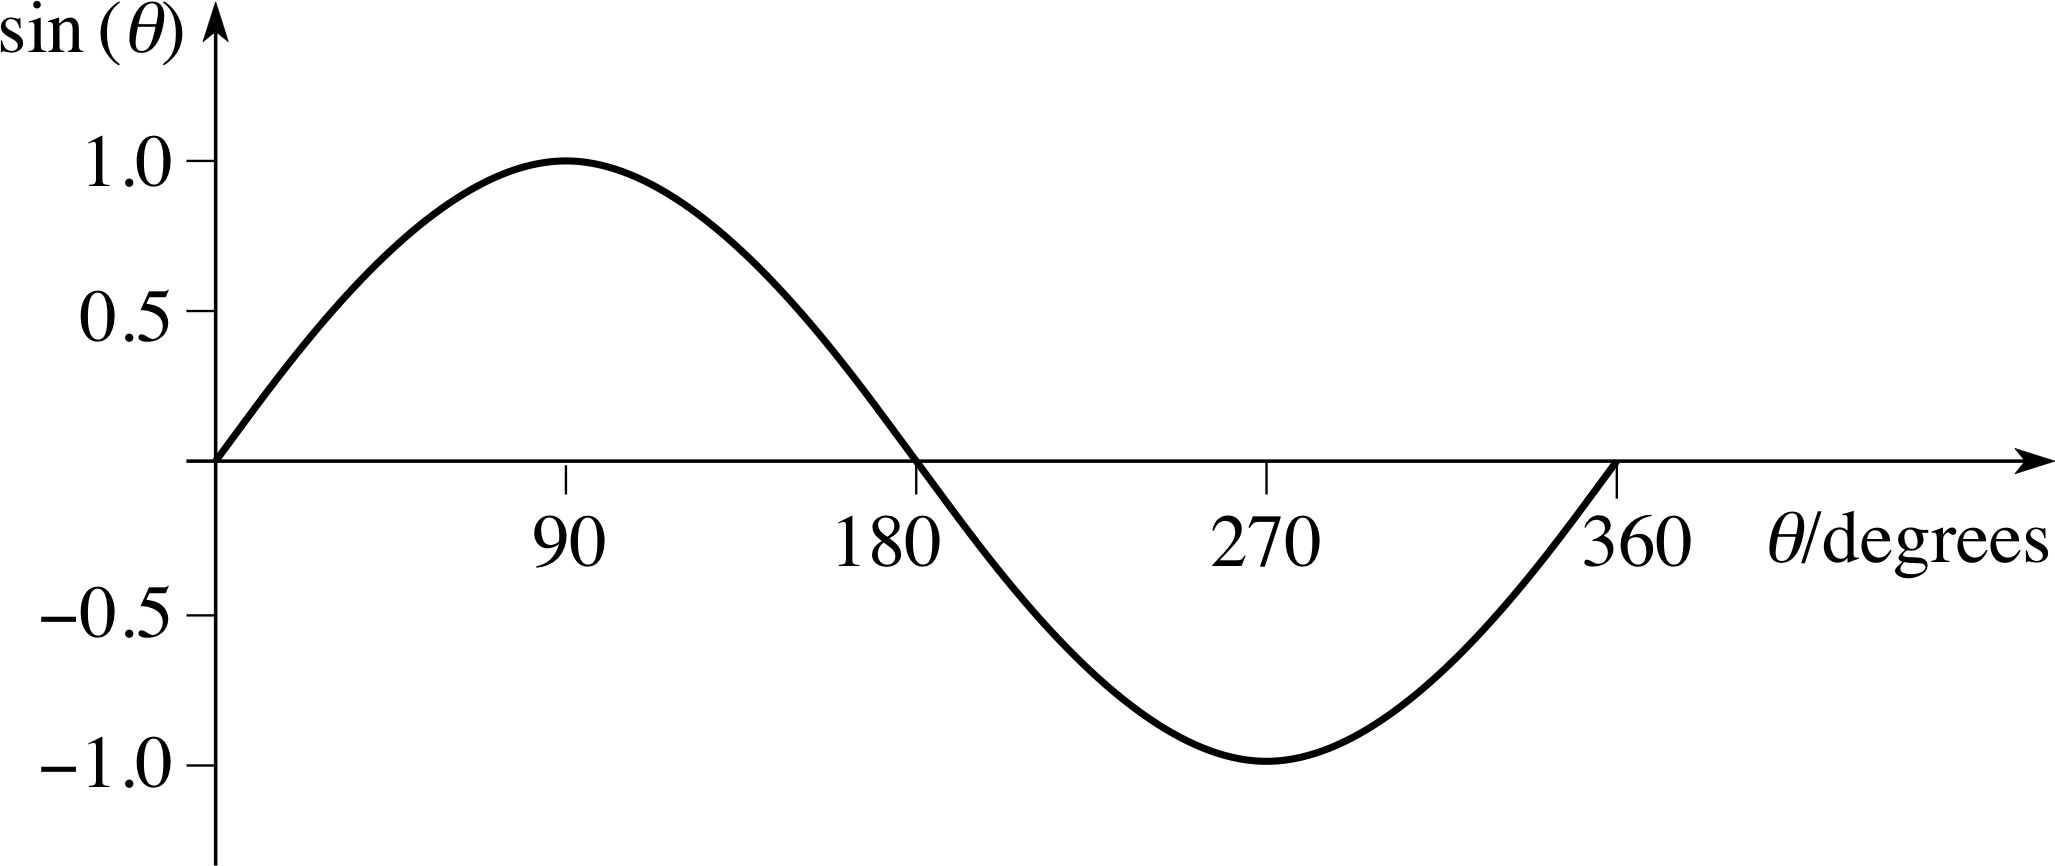
Figure 25 See Answer R1.
Answer R1
The graph of the sine of an angle against the size of the angle is illustrated in Figure 25.
Consult sinesine function in the Glossary for further information.
Question R2
If log10 x = 2.4, what is the value of x?
Answer R2
The statement log10 x = 2.4 means that x = 102.4 = 251.2. This can also be described by saying that x is the antilogarithm (to the base 10) of 2.4, i.e. antilog10 12.4 = x.
Consult logarithm and antilogarithm_functionantilogarithm in the Glossary for further information.
Question R3
Explain the meaning of the terms energy and power. What are suitable SI units for the measurement of these quantities?
Answer R3
The energy of a system is a measure of its ability to do work. Power may be defined as the rate at which work is done, or, equivalently, as the rate of energy transfer between systems. Since the SI unit of energy is the joule (J), it follows that a suitable unit in which to express power is the joule per second (J s−1) which is also known as the watt (W).
Consult energy and power in the Glossary for further information.
2 Sound waves and their propagation
2.1 The nature of sound waves

Figure 2 Representation of a longitudinal wave travelling along a spring.
Sound is a wave phenomenon: it consists of waves travelling through a medium (i.e. an appropriate material). The wavesnormally responsible for sound are of a particular kind known as longitudinal waves. Such waves are distinguished from other types of wave (such as transverse waves) by the fact that in a longitudinal wave the particles of the medium move back and forth along the direction in which the wave is travelling. Figure 2 shows a longitudinal wave propagating (i.e. travelling) along a spring. The wave consists of an alternating pattern of compressions (where the coils of the spring are closer together than on average) and rarefactions (where the coils are more widely separated than average). Such a wave may be created by moving one end of the spring back and forth as indicated; the elastic nature of the spring – its tendency to return to its original shape after a deformation – will then ensure that the wave propagates along the spring.
A sound wave (also known as an acoustic wave) is a longitudinal wave which is propagated through a medium (a solid, liquid or gas) by the oscillation of molecules about their mean positions. When the diaphragm, or cone, of a loudspeaker vibrates back and forth in air it generates compressions and rarefactions in the atmosphere, as indicated in Figure 3. In the regions of compression the pressure i, and hence the density (which is related to the pressure), of the air will be higher than average. Conversely, in the regions of rarefaction the pressure, and hence the density, is lower than average. Compressed or rarefied air tends to expand or contract until its pressure returns to the surrounding equilibrium value, so, to this extent, air is also able to act as an elastic medium through which compressions and rarefactions can travel. This is how sound usually reaches our ears.
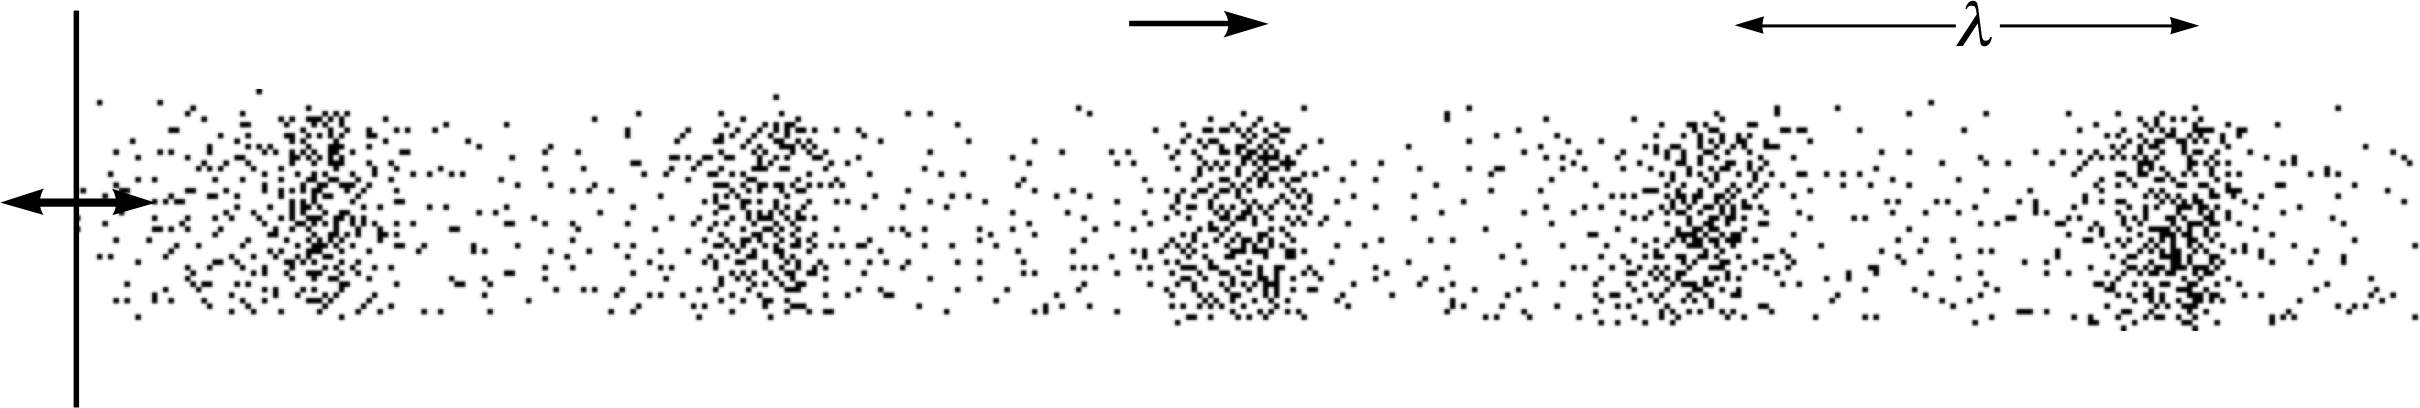
Figure 3 Representation of a (longitudinal) sound wave in air.
Sound waves in a uniform medium, created by regular movements, such as those illustrated in Figures 2 and 3, may be characterized by a speed of propagation υ (the speed at which each compression or rarefaction moves through the medium), and a wavelength λ i (the distance between consecutive points of equivalent disturbance from equilibrium, such as the centres of adjacent compressions). The time taken for any given part of the wave to execute one complete cycle of oscillation about its equilibrium position is called the period of the wave and is denoted by T. Since this is the time separating the passage of successive compressions past any fixed point on the path of the wave, it follows that the number of compressions per second passing such a fixed point will be given by the frequency f, where
$f = \dfrac1T$(1)
Dimensionally, the frequency f can be expressed in the same units as 1/T, i.e. s−1, but when using SI units it is more conventional to express frequencies in terms of hertz (Hz), where 1 Hz = 1 s−1. The average adult can hear sounds in the frequency range from 20 Hz to 20 000 Hz (i.e. 20 kHz), so this is known as the audio frequency range. Sound waves with frequencies within this range are perceived as sounds of different pitch. A frequency of 20 Hz would correspond to a low rumble, whereas 20 000 Hz to a high pitched whistle that would be beyond the audible range for many (but not all) adults. Sound waves with frequencies below 20 Hz are said to be infrasonic, and those with frequencies above 20 kHz are described as ultrasonic. i
The speed, wavelength and frequency of a wave are not independent of each other. Since any given compression must move a distance λ in a time T (= 1/f) it is inevitable that υ = λ/T, and it follows that
υ = f λ(2)

Figure 4a Changes in pressure and density plotted against position along the path of a sound wave, at a fixed time.
The variations of pressure and density in a sound wave at a particular time can be represented graphically as in Figure 4a, where the departures of pressure and density from their mean values are plotted against position x. The wavelength λ can be clearly seen to be the distance between consecutive points of maximum pressure or density.

Figure 4b Changes in pressure and density plotted against time, at a fixed point, on the path of a sound wave. Note that pressure and density are intrinsically positive quantities, but the changes in pressure and density plotted in this figure may be positive or negative.
In a similar way, the variation with time of the pressure and density at a particular point in space can be represented graphically as in Figure 4b. This kind ofgraph tells us nothing about the wavelength, but it clearly indicates the period of thewave, and hence its frequency f. From either set of graphs we can also determine another characteristic of the wave, its amplitude – the maximum positive value of the excess pressure P0, or density ρ0. i We will have more to say about the physical significance of the amplitude in Section 5, but it's worth pointing out at this stage that the amplitude influences the energy carried by the wave and thus plays a role in determining the loudness of sound.
Humans can detect sound waves in air with amplitudes as small as 3 × 10⁻⁵ N m−2, (the threshold of hearing), and as high as 30 N m−2: beyond that physical pain and damage to the ear may result. This range roughly corresponds to being able to hear sounds as quiet as a pin dropping and as loud as the music at a pop concert.
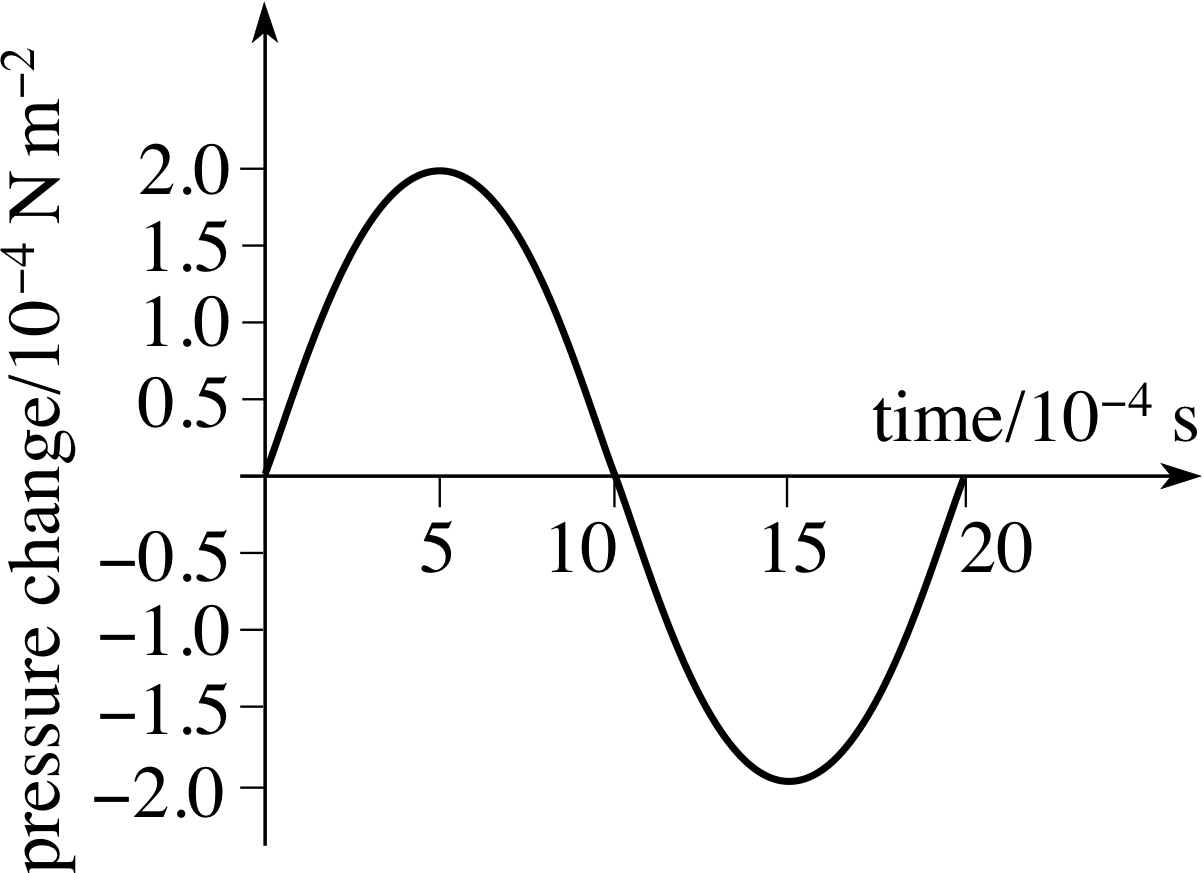
Figure 5 Changes in pressure against time at a fixed point, along the path of a sound wave.
✦ Figure 5 shows the variation of excess pressure with time, at a fixed point on the path of a sound wave. What is the amplitude of this wave, and what is its frequency? Can you deduce the wavelength of this wave from Figure 5? If not, what else would you need to know in order to do so?
✧ The amplitude is P0 = 2.00 × 10⁻⁴ N m−2, and the period is 20.0 × 10⁻⁴ s = 2.00 ms.
It follows that the frequency is f = 1/T = 500 Hz. There is no way of deducing the wavelength directly from Figure 5.
However, if we knew the speed υ of the sound we could use Equation 2,
υ = f λ(Eqn 2)
to find λ = υ/f. The speed of sound is the subject of the next subsection.
2.2 The speed of sound waves
Sound waves can travel through solids, liquids and gases but, since their transmission is dependent upon mechanical vibrations of a medium, they cannot travel through a vacuum. (When a science fiction film shows a spaceship exploding you shouldn’t expect to hear a loud bang!) The passage of a sound wave does not usually cause any net movement of the medium through which sound is transmitted, the particles of the medium just oscillate about their mean position. In air the effective amplitude of oscillation of any particular layer of air is of the order 1 mm, in liquids and solids it is usually much smaller.
| Material | Speed/m s−1 |
|---|---|
| air | 340 |
| aluminium | 5100 |
| glycerol | 1860 |
| hydrogen | 1286 |
| iron | 5130 |
| steel | 5060 |
| water | 1482 |
The speed of sound varies from one medium to another. Table 1 gives some examples. As a sound wave propagates, the particles in the transmitting medium are forced into longitudinal vibration. The speed with which the wave propagates depends on how easy it is to compress and expand the medium, that is it depends on the elasticity of the medium as measured by its modulus of elasticity. The modulus of elasticity of a sample of material may be defined, rather loosely, as follows:
$\text{modulus of elasticity} = \dfrac{\text{change of pressure}}{\text{fractional change of dimensions}}$
This definition is loose because there are actually several different moduli of elasticity, and which is used in a particular case depends on what type of deformation is involved and whether the material is a solid, liquid or gas. The speed of sound also depends on the density of the medium, and this too will depend on whether the medium is a solid, liquid or gas.
The speed of sound in solids
The appropriate modulus of elasticity for a solid is known as Young’s modulus (or the Young modulus). i If a cylindrical rod of length l and cross–sectional area A, increases its length by an amount ∆l when it is stretched by oppositely directed forces of magnitude F applied perpendicular to its ends, its Young’s modulus is given by
$Y =\dfrac{\text{ magnitude of perpendicular force per unit area of cross section}}{\text{fractional change in length}} = \dfrac{F/A}{\Delta l/l}$
The units of the Young’s modulus are N m−2.
It can be shown that the speed of sound in a solid of Young’s modulus Y and density ρsolid is given by
$\upsilon_{\rm solid} = \sqrt{\dfrac{Y\os}{\rho_{\rm solid}}}$(3) i
Solids usually have a higher density than liquids or gases, which tends to reduce the speed of sound, but many solids have such a large Young’s modulus that this more than compensates for the effects of density. Consequently, the speed of sound is usually higher in solids than in liquids, and much higher than in gases. The speed of sound in metallic solids is typically more than ten times greater than the speed of sound in air, as you can see from Table 1.
Question T1
Given that the Young’s modulus for steel is 2.00 × 10¹¹ N m−2, and using the value for the speed of sound in steel from Table 1, find the density of steel.
Answer T1
The speed of sound υ is related to the Young’s modulus Y and the density ρ by the equation
$\upsilon_{\rm solid} = \sqrt{\dfrac{Y\os}{\rho_{\rm solid}}}$(Eqn 3)
Therefore$\rho_{\rm solid} = \dfrac{Y}{\upsilon_{\rm solid}^2}$
For steel Y = 2.00 × 10¹¹ Pa and υ = 5060 m s−1, which gives us
$\rho = \rm \dfrac{2.00\times10^{11}\,Pa}{(5060\,m\,s^{-1})^2} = 7.81\times10^3\,kg\,m^{-3}$
The speed of sound in liquids
| Material | Speed/m s−1 |
|---|---|
| air | 340 |
| aluminium | 5100 |
| glycerol | 1860 |
| hydrogen | 1286 |
| iron | 5130 |
| steel | 5060 |
| water | 1482 |
For a liquid, the appropriate modulus of elasticity is known as the bulk modulus. If a sample of liquid of volume V changes its volume by an amount ∆V when subject to an excess pressure P, its bulk modulus is given by
$K = \dfrac{\text{applied pressure}}{\text{fractional change in volume}} = \dfrac{P}{\Delta V/V}$
It can be shown that the speed of sound in a liquid of density ρliquid is given by
$\upsilon_{\rm liquid} = \sqrt{\dfrac{K}{\rho_{\rm liquid}}}$(4) i
Most liquids are hard to compress, so they have a relatively large bulk modulus, nonetheless it is generally easier to compress a liquid than a solid, so the speed of sound is usually lower in liquids than in solids.
Question T2
Given that the density of water is 1000 kg m−3 and the speed of sound in water is as given in Table 1, find the bulk modulus for water.
Answer T2
The speed of sound υ in a liquid is related to the bulk modulus K and the density ρ by the equation
$\upsilon_{\rm liquid} = \sqrt{\dfrac{K}{\rho_{\rm liquid}}}$(Eqn 4)
For water ρ = 1000 kg m−3 and υ = 1482 m s−1
ThereforeK = υ2ρ = (1482 m s−1)2 × 1000 kg m−3
giving the value of the bulk modulus for water as 2.20 × 10⁹ Pa.
The speed of sound in gases
In the case of a gas we are once again interested in the bulk modulus, but greater care is needed than in the case of a liquid because a gas has several significantly different bulk moduli. The problem arises because when gases are compressed rapidly their temperature tends to rise, whereas, if they are compressed slowly they usually exchange heat with their surroundings and thereby maintain a constant temperature. These different conditions result in different amounts of compression for a given change in external pressure and hence correspond to different bulk moduli. In fact, it can be shown that the relevant bulk modulus for the compressions and rarefactions that correspond to sound waves in a gas is that in which no heat flows, and this has the value γP, where P is the pressure of the gas and γ is a dimensionless constant that characterizes the gas. Consequently, the speed of sound in a gas of density ρgas is given by
$\upsilon_{\rm gas} = \sqrt{\dfrac{\gamma P}{\rho_{\rm gas}}}$(5) i
As you can see from Table 1, sound travels relatively slowly through gases compared with solids and liquids. However, since the speed of sound in a gas depends on its pressure and density, it is relatively easy to change the speed of sound in a particular gas (such as air).
✦ Imagine a sealed, rigid box filled with air. If the air is heated, what will happen to the speed of sound in the air?
✧ If the temperature is increased whilst maintaining the air at a constant volume, its pressure will increase. Since the density of the air is constant (neither the mass of air nor its volume changes), it follows from Equation 5,
$\upsilon_{gas} = \sqrt{\dfrac{\gamma P}{\rho_{\rm gas}}}$(Eqn 5)
that the speed of sound will increase.
✦ The box of air is now modified so that it has a piston at one end, allowing the air to expand so maintaining a constant pressure. What will happen to the speed of sound in the air if the air is heated now?
✧ As the temperature increases, the air will expand but maintain the same pressure as the piston moves. The same mass of air now occupies a larger volume, so its density must decrease. Hence, from Equation 5,
$\upsilon_{gas} = \sqrt{\dfrac{\gamma P}{\rho_{\rm gas}}}$(Eqn 5)
the speed of sound in the air once again increases.
In view of the sensitivity of the speed of sound to temperature, it is possible to use measurements of the speed as a way of determining the temperature of a gas. This may sound like a very complicated way of measuring temperature, but in some environments, such as a large oven or a furnace, it can be the easiest and most reliable technique.
Another consequence of the sensitivity of sound speed to local conditions of temperature and pressure is that a moving object whose speed relative to the medium is supersonic (greater than the speed of sound) at some point, may well be subsonic (less than the speed of sound) at some other point where the conditions are different. Because of this it is useful when dealing with the movement of objects through fluids (or even the motion of one part of a fluid relative to another) to introduce a quantity called the Mach number; this is defined as the speed of the object (or flow) divided by the local speed of sound. The Mach number of the Concorde airliner is displayed in the passenger cabin throughout the flight, so that passengers can appreciate the fact that they are travelling faster than sound; they may or may not appreciate the fact that the local speed of sound outside the cabin also varies throughout the flight.
| Material | Speed/m s−1 |
|---|---|
| air | 340 |
| aluminium | 5100 |
| glycerol | 1860 |
| hydrogen | 1286 |
| iron | 5130 |
| steel | 5060 |
| water | 1482 |
2.3 Sound travelling through different media
If a sound wave travels from one medium to another the frequency stays the same, but the speed and wavelength may change. For example, the speed of sound going from air to a metal, such as steel, increases from about 340 m s−1 to about 5 060 m s−1 because the modulus of elasticity of steel is very much greater than that for air. You may have seen an actor in a Western film put his ear to a railway line to listen for an oncoming train. This gives an earlier warning of an approaching train because the sound waves travel much faster and move effectively through a steel track than through air. i
Question T3
Using Equation 2,
υ = f λ(Eqn 2)
the value for the speed of sound in air given in Table 1, and the values for the range of audio frequencies given in Subsection 2.1, find the range of wavelengths corresponding to the audio frequency range in air. Explain why the range of wavelengths corresponding to the audio frequencies is not always the same.
Answer T3
The speed of sound in air υ = 340 m s−1, the lowest audible frequency f1 is 20 Hz and the highest frequency f2 is 20 kHz.
Using the relationship,
υ = f λ(Eqn 1)
the wavelength, λ1, corresponding to frequency f1 is given by
$\lambda_1 = \dfrac{\upsilon}{f_1} = \rm \dfrac{340\,m\,s^{-1}}{20\,s^{-1}} = 17\,m$
Similarly, λ2 is found to be 1.7 × 10⁻² m or 17 mm. Therefore the range of wavelengths corresponding to the audio frequencies is from 17 mm to 17 m.
Since the speed of sound in air varies, depending on the pressure and density, so the wavelengths corresponding to the range of audio frequencies must also vary as the pressure and density of the air changes.
Question T4
If the wavelength of sound in air is 2.0 m, what is (a) the frequency and (b) the wavelength of the same sound travelling through steel? (Use the values for the speed of sound in air and steel from Table 1).
Answer T4
(a) The frequency is independent of the medium through which the sound travels.
Therefore$f_{\rm steel} = f_{\rm air} = \dfrac{\upsilon_{|rm air}}{\lambda_{|rm air}} = \rm \dfrac{340\,m\,s^{-1}}{2.0\,m} = 170\,Hz$
(b) From Table 1, the speed of sound in steel υsteel is 5060 m s−1.
Therefore the wavelength λsteel is given by
$\lambda_{\rm steel} = \dfrac{\upsilon_{\rm steel}}{f_{\rm steel}} = \rm \dfrac{5060\,m\,s^{-1}}{170\,s^{-1}} = 29.8\,m$
3 The Doppler effect
Most people have had direct experience of the Doppler effect. i Perhaps its commonest manifestation is in the sound of a passing vehicle, such as a train or a motorcycle. The most obvious feature of the sound of a passing vehicle is that it gets louder as the vehicle approaches, and fainter as it gets further away, which has nothing to do with the Doppler effect. However, if you ignore the changing loudness of the sound and listen instead to its pitch (i.e. its frequency), then you will notice the Doppler effect. The pitch is higher when the vehicle is approaching than when it is receding. It is this dependence of the observed pitch on the motion of the vehicle that exemplifies the Doppler effect. Similar effects arise when an observer, such as yourself, moves towards or away from a fixed source of sound. In fact, we can say that generally:
The Doppler effect is the phenomenon that the observed frequency of a sound wave is influenced by the relative motion of the source and the observer. i
In the rest of this section we will explain the cause of the Doppler effect and derive formulae relating the observed frequency fobs of a sound wave to the frequency with which it is emitted from a source fsource under various conditions. However, before embarking on that analysis, it is worth noting that the Doppler effect is of considerable importance in physics since it applies to all wave phenomena, not just sound.
Doppler himself realized this and tried to apply it to light. Unfortunately his imperfect understanding of light waves led him to apply the wrong formulae in that case, but he was quite right in thinking that light should exhibit a ‘Doppler effect’ and such effects now have many practical applications.
3.1 A moving source of sound
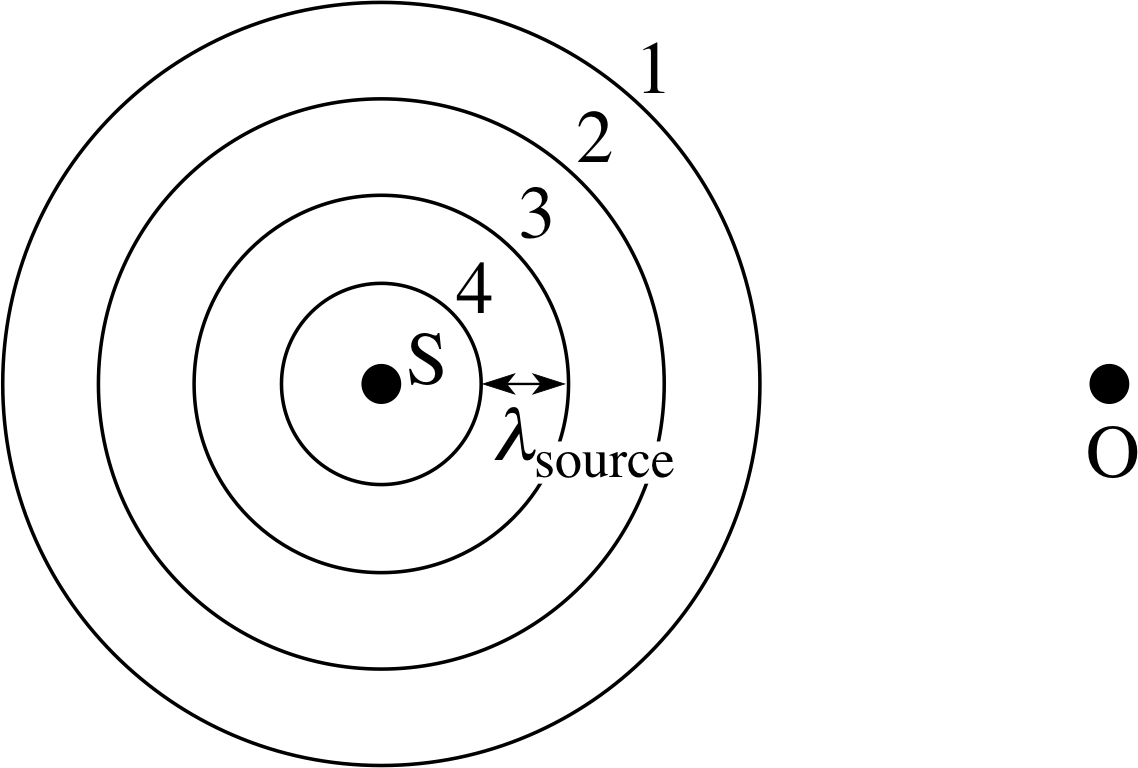
Figure 6 Stationary source of sound and stationary observer.
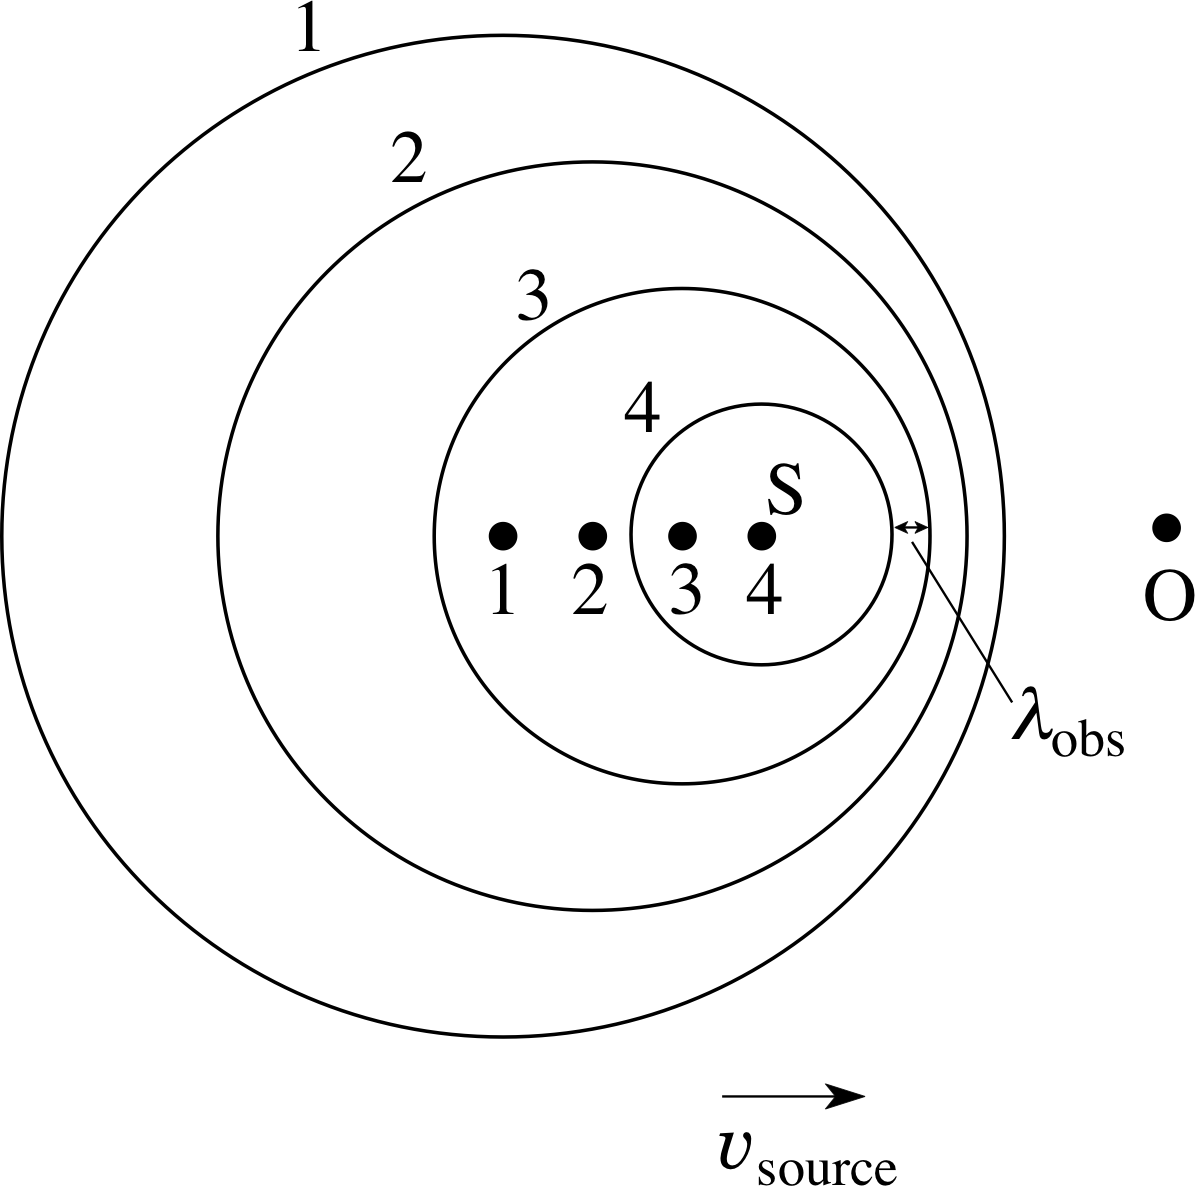
Figure 7 Moving source of sound and stationary observer.
Figure 6 shows a stationary source of sound S and a stationary observer O. The source emits sound waves with a frequency fsource. The waves spread out equally in all directions, so the travelling compressions and rarefactions take the form of expanding spherical shells surrounding the source. The concentric circles in Figure 6 represent the (spherical) surfaces of maximum pressure in four successive compressions of the sound wave at a particular time. i
Hence the separation between one circle and the next is the wavelength of the emitted sound λsource, and the circles are expanding at the speed of
sound as given by υsound = fsource × λsource. The time interval between emitting one compression and the next is the period of the sound wave Tsource = 1/fsource. The stationary observer receives these compressions with the same spacing between them as when they were emitted by the source, and with the same time interval between them. Hence the wavelength and frequency of the sound measured by the observer are the same as those of the sound emitted at the source.
The cause of the Doppler effect for the case where the source of sound is moving is illustrated in Figure 7. An observer O is stationary and the source of sound S is moving towards the observer with a speed υsource. As before, the source emits sound waves with a frequency fsource. The concentric circles in Figure 7 again represent the surfaces of maximum pressure in four successive compressions of the sound wave at a particular time. Notice that, since the source is now travelling in the direction shown, by the time the source emits compression number 2 it has moved to catch up slightly with compression number 1. A similar effect exists for each of the four compressions shown. The net result is that the observer O receives compressions which appear to be closer together than the original wavelength λsource. This is equivalent to observing an increase in the frequency, i.e. a higher pitched sound.
To calculate exactly how much higher the frequency is, we can reason as follows. During one period of the sound wave, the source moves a distance d = υsource × T source = υsource /fsource towards the observer. So the apparent wavelength measured at O is λobs = λsource − d. Hence:
$\lambda_{\rm obs} = \lambda_{\rm source} - \dfrac{\upsilon_{\rm source}}{f_{\rm source}}$(6)
We can express Equation 6 in terms of frequencies since we can write:
λobs = υsound /fobs and λsource = υsound /fsource
Therefore$\dfrac{\upsilon_{\rm sound}}{f_{\rm obs}} = \dfrac{\upsilon_{\rm sound}}{f_{\rm source}} - \dfrac{\upsilon_{\rm source}}{f_{\rm source}}$
which can be rearranged to give
$f_{\rm obs} = f_{\rm source}\left[\dfrac{1}{1-\left(\left.\upsilon_{\rm source}\,\middle/\upsilon_{\rm sound}\right.\right)}\right]$(7) i
So we can see that the frequency measured by a stationary observer as a source of sound moves towards him will be higher than that emitted by the source, as stated earlier.
✦ What would be the frequency measured by a stationary observer if a source of sound of frequency fsource was moving away with a speed υsource?
✧ By a similar argument to that used above, the frequency measured by the observer would be:
$f_{\rm obs} = f_{\rm source}\left[\dfrac{1}{1+\left(\left.\upsilon_{\rm source}\middle/\upsilon_{\rm sound}\right.\right)}\right]$(8) i
Notice the change of sign from minus to plus. In this case, the measured frequency will be lower than that emitted by the source.
An important point to realize is that the arguments used here rely on the assumption that the medium through which the sound wave is travelling (the air) is not moving. If there is a wind blowing for instance, the whole situation becomes rather more complicated.
Question T5
A train travelling at 25 m s−1 passes a stationary observer standing at the side of the track. A whistle on the train is blowing and has a frequency of 1500 Hz as heard in the cab of the train. If the speed of sound in air is 340 m s−1, what is the change in frequency heard by the observer as the train passes?
Answer T5
As the train approaches, the frequency measured by the stationary observer may be calculated using Equation 7:
$f_{\rm obs} = f_{\rm source}\left[\dfrac{1}{1-\left(\left.\upsilon_{\rm source}\,\middle/\upsilon_{\rm sound}\right.\right)}\right]$
$\phantom{f_{\rm obs} }= \rm 1500\,Hz\left[\dfrac{1}{1-\left(\left.25\,m\,s^{-1}\,\middle/340\,m\,s^{-1}\right.\right)}\right] = 1619\,Hz$
As the train recedes, the frequency measured by the stationary observer may be calculated using Equation 8:
$f_{\rm obs} = f_{\rm source}\left[\dfrac{1}{1+\left(\left.\upsilon_{\rm source}\middle/\upsilon_{\rm sound}\right.\right)}\right]$
$\phantom{f_{\rm obs} }= \rm 1500\,Hz\left[\dfrac{1}{1+\left(\left.25\,m\,s^{-1}\middle/340\,m\,s^{-1}\right.\right)}\right] = 1397\,Hz$
So the change in frequency as the train passes is (1619 − 1397) Hz = 222 Hz.
3.2 A moving observer
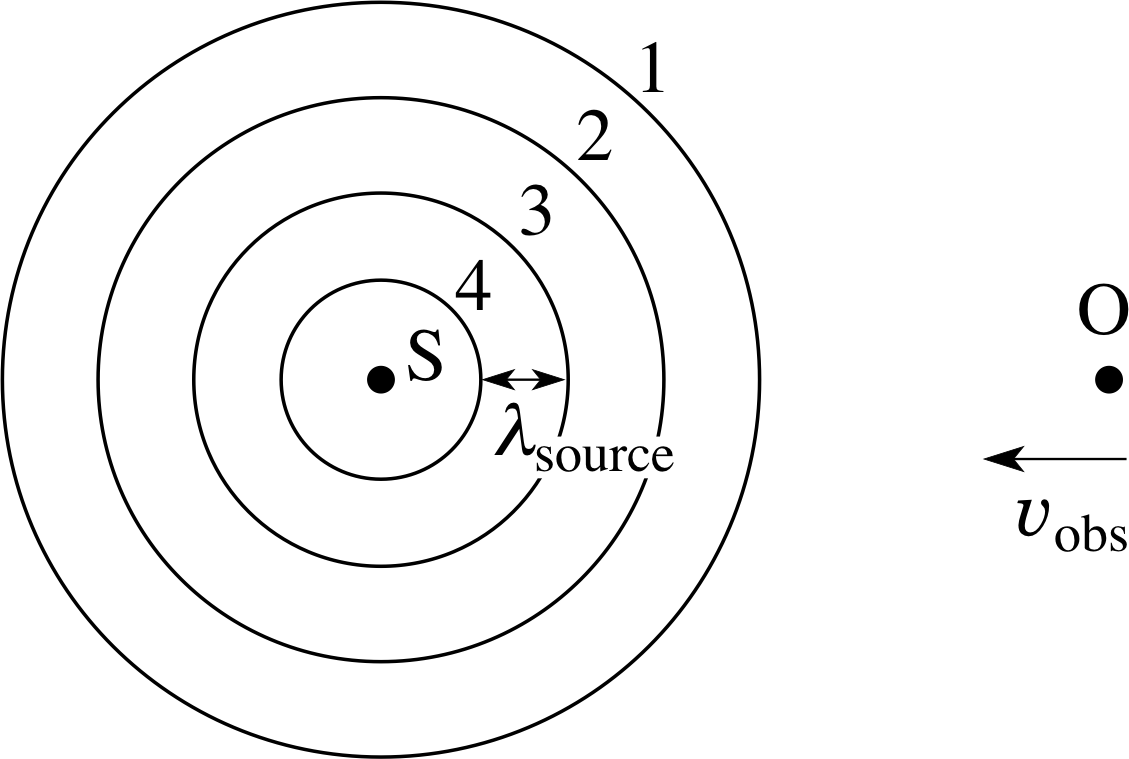
Figure 8 Stationary source of sound and moving observer.
Figure 8 shows the situation where a stationary source is emitting sound waves of frequency fsource and an observer is approaching the source at a speed υobs. Four successive compressions are once again indicated, centred on the source. In this case, the observer is receiving, or crossing, compressions more often than if the observer were stationary and so the measured wavelength is shorter. Equivalently, the measured frequency is higher.
The procedure to calculate this frequency shift is slightly different to the case of a moving source encountered in the previous subsection. As the observer moves towards the source of sound, the relative speed between the observer and the compression is simply (υsound + υobs). Since the compressions are a distance λsource apart, the time taken between crossing one and then crossing the next is
$T_{\rm obs} = \dfrac{\lambda_{\rm source}}{\upsilon_{\rm sound} + \upsilon_{\rm obs}}$(9)
As before, we really want a relationship involving frequencies, so we still have some work to do. We can rewrite the observed period in terms of the frequency measured by the observer by using Tobs = 1/fobs. We can also rewrite the wavelength emitted by the source as λsource = υsound/fsource. Making these substitutions, Equation 9 becomes
$\dfrac{1}{f_{\rm obs}} = \dfrac{\left.\upsilon_{\rm sound}\,\middle/f_{\rm source}\right.}{\upsilon_{\rm sound} + \upsilon_{\rm obs}}$
This may in turn be rearranged to give
$f_{\rm obs} = f_{\rm source}\left(1+\dfrac{\upsilon_{\rm obs}}{\upsilon_{\rm sound}}\right)$(10) i
Therefore the frequency measured by an observer moving towards a stationary source of sound is increased, as stated earlier.
✦ What would be the frequency measured by an observer moving away with a speed of υobs from a source of sound of frequency fsource?
✧ Following a similar argument to that used above, the frequency measured by an observer moving away from a stationary source of sound would be:
$f_{\rm obs} = f_{\rm source}\left(1-\dfrac{\upsilon_{\rm obs}}{\upsilon_{\rm sound}}\right)$(11) i
The measured frequency in this case is lower than that emitted by the source.
As in the previous subsection, this derivation relies on the assumption that the air through which the sound waves are travelling is stationary.
We may summarize the distinction between a moving source and a moving observer in the following way. When it is the source that is moving the wave travels at the same wave velocity in the air but successive wave crests are advanced or retarded due to the motion of the source. The observer believes the wavelength is changed and with the same wave velocity this implies a frequency change. When it is the observer moving the position of the wave crests and their motion through the material is unchanged but the observer believes the speed of sound is different because his motion must be added to that of the wave in still air. In this case the observer crosses wave crests at a different rate and so the observed frequency and wavelength both change. In both cases it is the speed of sound in still air which is fixed by the properties of the material but any motion of the observer through the still air must be added to this for the observed speed of sound.
Question T6
A footballer, running towards a referee at a speed of 8.5 m s−1, hears the sound of the referee’s whistle with a frequency of 2500 Hz. If the speed of sound is 340 m s−1, (a) what is the frequency of the whistle heard by the referee, and (b) what is the frequency of the whistle heard by the footballer as he runs away from the referee at the same speed as before?
Answer T6
(a) The frequency heard by the referee is the same as that emitted by the whistle f2 and is found using Equation 10:
$f_{\rm obs} = f_{\rm source}\left(1+\dfrac{\upsilon_{\rm obs}}{\upsilon_{\rm sound}}\right)$
Hence$2500\,{\rm Hz} = f_{\rm source}\left(1+ \dfrac{8.5\,{\rm m\,s^{-1}}}{340\,{\rm m\,s^{-1}}}\right) = f_{\rm source}\times1.025$
So,fsource = 2439 Hz.
(b) The frequency heard by the footballer as he runs away from the referee is found using Equation 11:
$f_{\rm obs} = f_{\rm source}\left(1-\dfrac{\upsilon_{\rm obs}}{\upsilon_{\rm sound}}\right)$
Hence$f_{\rm obs} =\rm 2439\,Hz\times\left(1-\dfrac{8.5\,m\,s^{-1}}{340\,m\,s^{-1}}\right) = 2439\,Hz\times0.975$
So,fobs = 2378 Hz.
3.3 The general case
The general relationship between the frequency measured by an observer and the frequency emitted by a source of sound, when both are moving, is given by
the Doppler shift equation $\dfrac{f_{\rm obs}}{f_{\rm source}} = \dfrac{1\pm\left(\left.\upsilon_{\rm obs}\middle/\upsilon_{\rm sound}\right.\right)}{1\mp\left(\left.\upsilon_{\rm source}\middle/\upsilon_{\rm sound}\right.\right)}$(12)
| fobs/fsource | Observer moving towards source |
Observer moving away from source |
|---|---|---|
| Source moving towards observer |
$\dfrac{1+\left(\left.\upsilon_{\rm obs}\middle/\upsilon_{\rm sound}\right.\right)}{1-\left(\left.\upsilon_{\rm source}\middle/\upsilon_{\rm sound}\right.\right)}$ | $\dfrac{1-\left(\left.\upsilon_{\rm obs}\middle/\upsilon_{\rm sound}\right.\right)}{1-\left(\left.\upsilon_{\rm source}\middle/\upsilon_{\rm sound}\right.\right)}$ |
| Observer moving away from source |
$\dfrac{1+\left(\left.\upsilon_{\rm obs}\middle/\upsilon_{\rm sound}\right.\right)}{1+\left(\left.\upsilon_{\rm source}\middle/\upsilon_{\rm sound}\right.\right)}$ | $\dfrac{1-\left(\left.\upsilon_{\rm obs}\middle/\upsilon_{\rm sound}\right.\right)}{1+\left(\left.\upsilon_{\rm source}\middle/\upsilon_{\rm sound}\right.\right)}$ |
The top line contains a plus sign if the observer is moving towards the source and a minus sign if the observer is moving away from the source. Conversely, the bottom line contains a minus sign if the source is moving towards the observer and a plus sign if the source is moving away from the observer.
The four possible cases are summarized in Table 2. In each case, the speed of the observer and the speed of the source of sound are their speeds relative to the stationary air (or other medium) through which the sound is moving.
✦ Show that the Doppler shift equation (Equation 12) is compatible with the results derived in Subsections 3.1 and 3.2 for the cases of a stationary observer and a source stationary source, respectively.
✧ When the observer is stationary, υobs = 0 and the Doppler shift equation (Equation 12) becomes
$\dfrac{f_{\rm obs}}{f_{\rm source}} = \dfrac{1}{1\mp\left(\left.\upsilon_{\rm source}\,\middle/\upsilon_{\rm sound}\right.\right)}$
which is the same as Equations 7 and 8,
$f_{\rm obs} = f_{\rm source}\left[\dfrac{1}{1-\left(\left.\upsilon_{\rm source}\,\middle/\upsilon_{\rm sound}\right.\right)}\right]$(Eqn 7)
$f_{\rm obs} = f_{\rm source}\left[\dfrac{1}{1+\left(\left.\upsilon_{\rm source}\,\middle/\upsilon_{\rm sound}\right.\right)}\right]$(Eqn 8)
Similarly, when the source is stationary, υsource = 0 and Equation 12 becomes
$f_{\rm obs} = f_{\rm source}\left(1\pm\dfrac{\upsilon_{\rm obs}}{\upsilon_{\rm sound}}\right)$
which is the same as Equations 10 and 11,
$f_{\rm obs} = f_{\rm source}\left(1+\dfrac{\upsilon_{\rm obs}}{\upsilon_{\rm sound}}\right)$(Eqn 10)
$f_{\rm obs} = f_{\rm source}\left(1-\dfrac{\upsilon_{\rm obs}}{\upsilon_{\rm sound}}\right)$(Eqn11)
Aside As mentioned earlier, the Doppler effect is common to all wave phenomena, though the detailed mathematical relations will depend on the case being considered. (Even for sound the results would have been different if the air had not been still or if the source and the observer had each been moving, but along different lines.) In the important case of light for example, the speed of propagation is so high that effects explained by Einstein’s special theory of relativity have to be taken into account. In this respect the Doppler effect with light is quite different from that with sound. It is an observed fact and a tenet of special relativity that the measured speed of light in a vacuum is independent of any motion of the source or the observer.
The addition of velocities under special relativity is quite different from that assumed here. For all electromagnetic waves, such as light, these ideas lead to the relation analogous to Equation 12, taking the form:
$f_{\rm obs} = f_{\rm source}\left[\left.{\left(1-\dfrac{\upsilon_{\rm r}^2}{c^2}\right)^{1/2}}\middle/{\left(1\mp\dfrac{\upsilon_{\rm r}\os}{c}\right)}\right.\right]$ i
where c is the speed of light in a vacuum, υr is the relative speed of the source and observer and the minus sign in the denominator applies when the source and the observer are getting closer together.
4 Reflection and refraction of sound
4.1 Reflection of audible sound
You are probably familiar with the idea of light waves being reflected. Similarly, sound waves in air can be reflected by a solid obstacle, such as the side of a house or the face of a cliff. This is the way that echoes are produced. The interval between the original sound and the echo is the time taken for the sound to travel to the reflecting surface and back again.
Question T7
A girl stands in front of a wall and claps her hands. She hears the echo of the hand clap half a second later. Given that the speed of sound in air is 340 m s−1, how far in front of the wall was she standing?
Answer T7
If the distance between the girl and the wall is d, the sound travels a distance 2d, (to the wall and back), in the time, t, between the girl clapping her hands and her hearing the echo.
The speed of sound in air υ = 340 m s−1 and the time of travel t = 0.5 s.
Therefore, as distance = speed × time
we have 2d = 340 m s−1 × 0.5 s
sod = 85 m
The reflection of sound waves depends on the surface features of the object doing the reflecting. A narrow beam of sound impinging on a smooth flat surface at an angle of incidence, θi, to the normal (the line perpendicular to the surface) will be reflected by the surface in such a way that the angle of reflection, θR, (between the reflected beam and the normal) is equal to the angle of incidence.
This is illustrated in Figure 9 and is an example of the law of reflection.
Figure 10 Reflection from a parabolic surface.
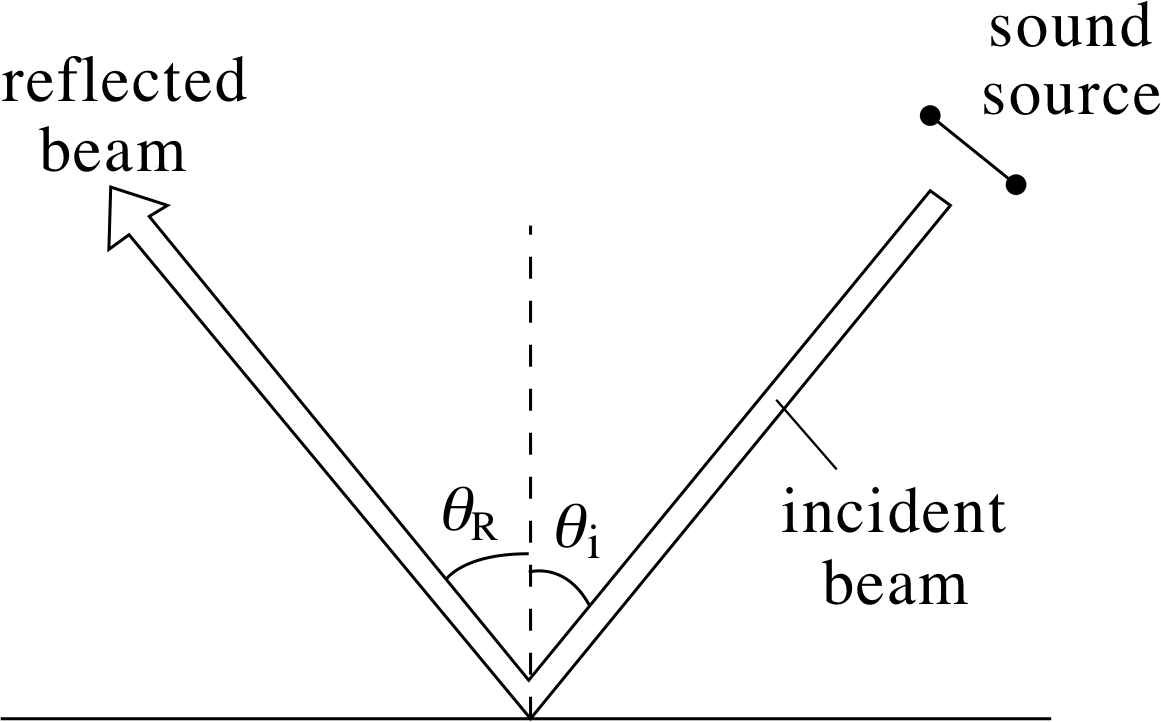
Figure 9 Reflection of sound from a flat surface.
Sound waves always obey the law of reflection, even if the surface from which they are reflecting is not flat. For example, if sound waves from a distant source fall on a large smooth parabolic surface, they are reflected and come to a focus. Conversely, such a parabolic surface will reflect sound waves to long distances if the source of sound is placed at its focus. Figure 10 illustrates these effects.
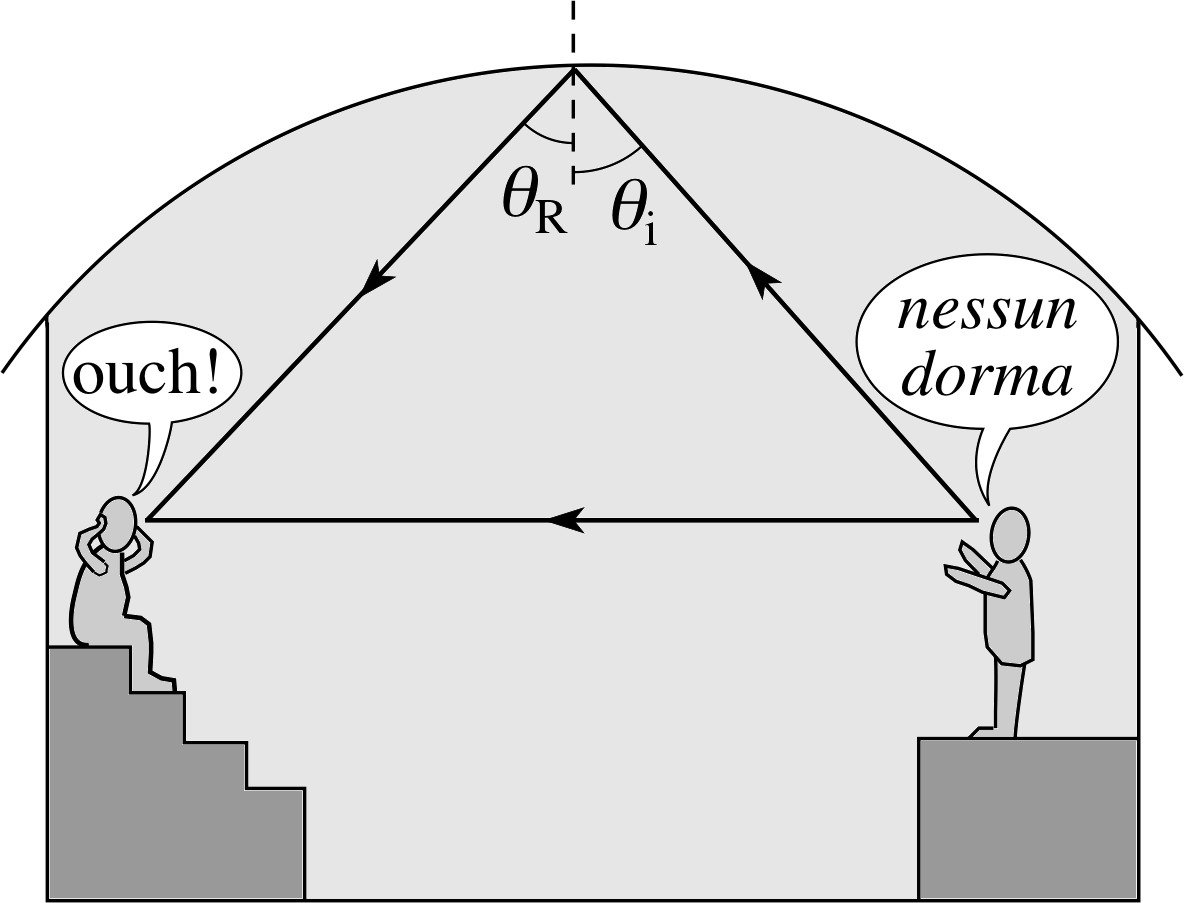
Figure 13 Unwanted echoes.
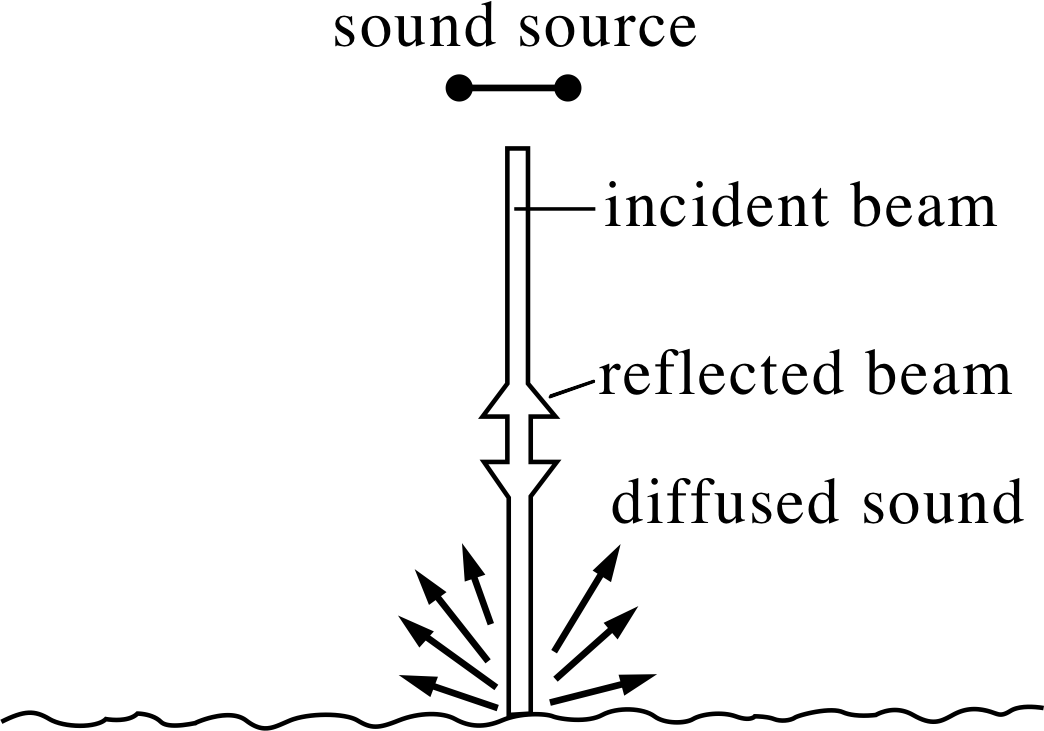
Figure 12 Diffuse reflection of sound.
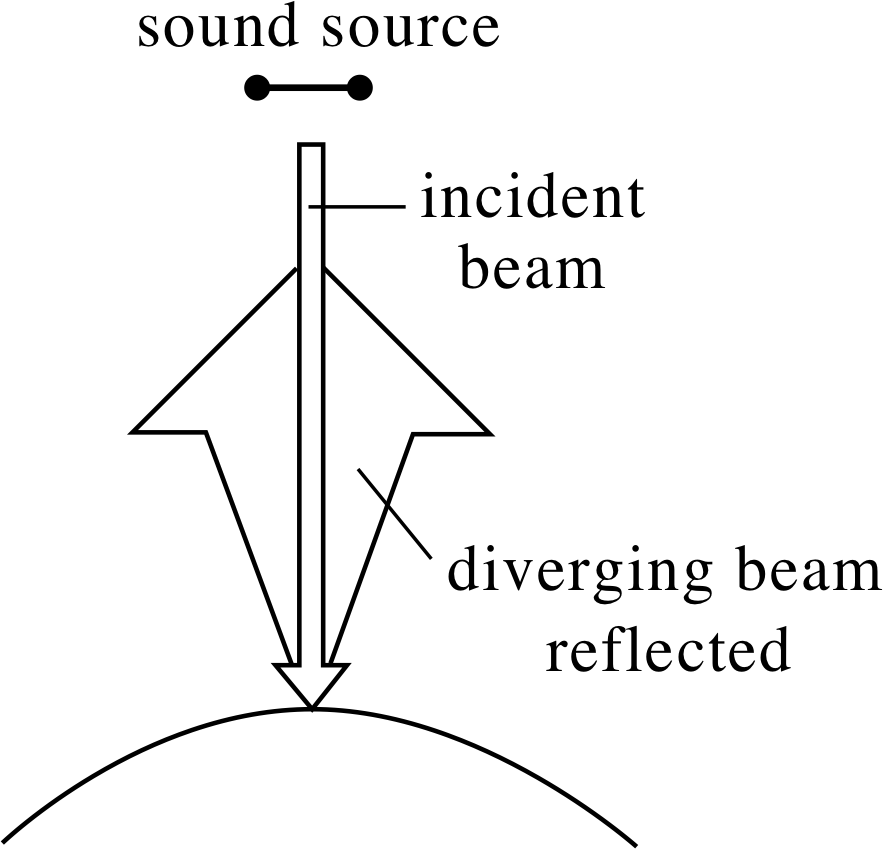
Figure 11 Reflection of sound from a diverging surface.
Sound impinging on a smooth convex (outwards curving) surface will spread out into a diverging beam, as shown in Figure 11.
If the surface is rough the sound will be diffusely reflected, which means that the reflected waves are all travelling in different directions. This is illustrated in Figure 12.
The effects of the reflection of sound waves are wide ranging. We will look at two of them which may be described as: an amusing diversion and an annoyance.
An amusing diversion The famous whispering gallery of St. Paul’s cathedral is a circular shaped chamber whose walls repeatedly reflect sound waves round the gallery, so that a person talking quietly at one side can be heard distinctly by someone far away on the other side.
An annoyance The Royal Albert Hall, which was opened in 1871, was hailed as an acoustic disaster. The main problem was the echo. A member of the audience received sound directly from the source and by reflection from the dome–shaped ceiling, as illustrated in Figure 13. Special baffles (shaped like upside down mushrooms) were eventually fixed to the ceiling to improve the acoustics.
4.2 Reflection of ultrasound
In Subsection 2.1 we saw that audible sound covers a range of frequencies from approximately 20 Hz to 20 kHz and a corresponding range of wavelengths (in air) from around 17 m to 17 mm. Sound waves with higher frequencies (or shorter wavelengths) than this are inaudible to humans and are classified as ultrasonic waves.
Many useful applications of ultrasound have been developed during the last half-century. Some automatic focus cameras use ultrasound echo–location to determine the distance to the object being photographed. Bats use ultrasonic waves in their echo–location system. The bat emits a short burst of ultrasound and is able to detect the echoes produced by the reflection of the ultrasound off trees, the ground and insects, etc. From the time taken for the ultrasound to make the round trip the bat is able to determine the distances to the objects. It is also able to take into account the movement of itself and its prey, for example.
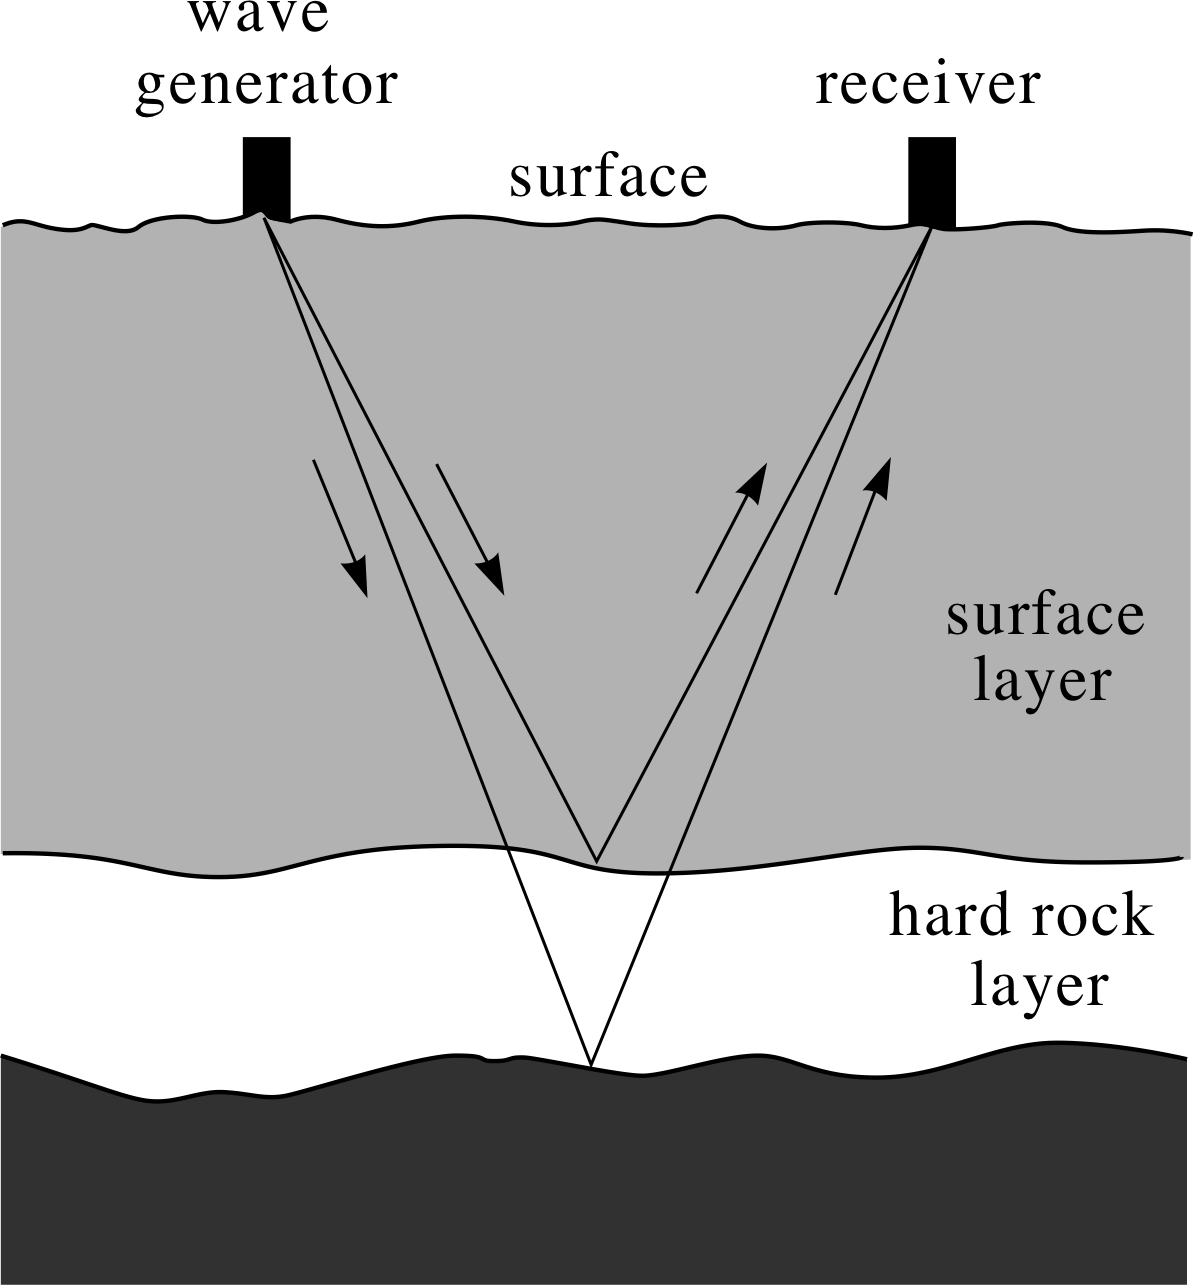
Figure 14 Seismic surveying.
Ultrasonic reflection is used for seismic surveying. This process is illustrated in Figure 14. A loud impact on the ground, created by an explosive charge or by dropping a heavy weight, creates ultrasonic waves that travel into the earth and are reflected back from the underground rock layers. i These waves are detected by instruments at the surface.
It is also possible to locate cracks in metals by using ultrasonic reflection. The ultrasonic waves are sent into the metal under investigation, and the beam reflected back from the fault is detected together with the reflection from the other end of the metal. The position of the fault can then easily be located.
Perhaps the widest application of ultrasonics is in medicine, where ultrasound is routinely used to form images of internal organs and of foetuses in pregnant women. The image is built up by scanning the area with an ultrasound emitter/detector and recording the reflected sound waves. Soft tissue–bone interfaces reflect strongly, but other interfaces reflect more weakly.
Question T8
For ultrasonic examination of unborn babies, a frequency of 2.0 MHz is used. If the speed of sound in the uterus is 1.5 × 10³ m s−1, what is the wavelength of these waves, and hence, what is the size of the smallest foetus detectable if this is equal to the wavelength of the ultrasonic waves?
Answer T8
Since we know that
υ = f λ(Eqn 1)
the wavelength, λ can be found from
$\lambda = \dfrac{\upsilon}{f}$
In this question we are given that f = 2.0 × 10⁶ Hz and υ = 1.5 × 10³ m s−1. Therefore
$\lambda = \rm \dfrac{1.5\times10^3\,m\,s^{-1}}{2.0\times10^6\,s^{-1}} = 7.5\times10^{-4}\,m$
The smallest foetus detectable is thus approximately 1 mm in length.
(Note that, in practice, the smallest foetus clearly visible is of the order a couple of centimetres in length, corresponding to a gestation age of about eight weeks.)
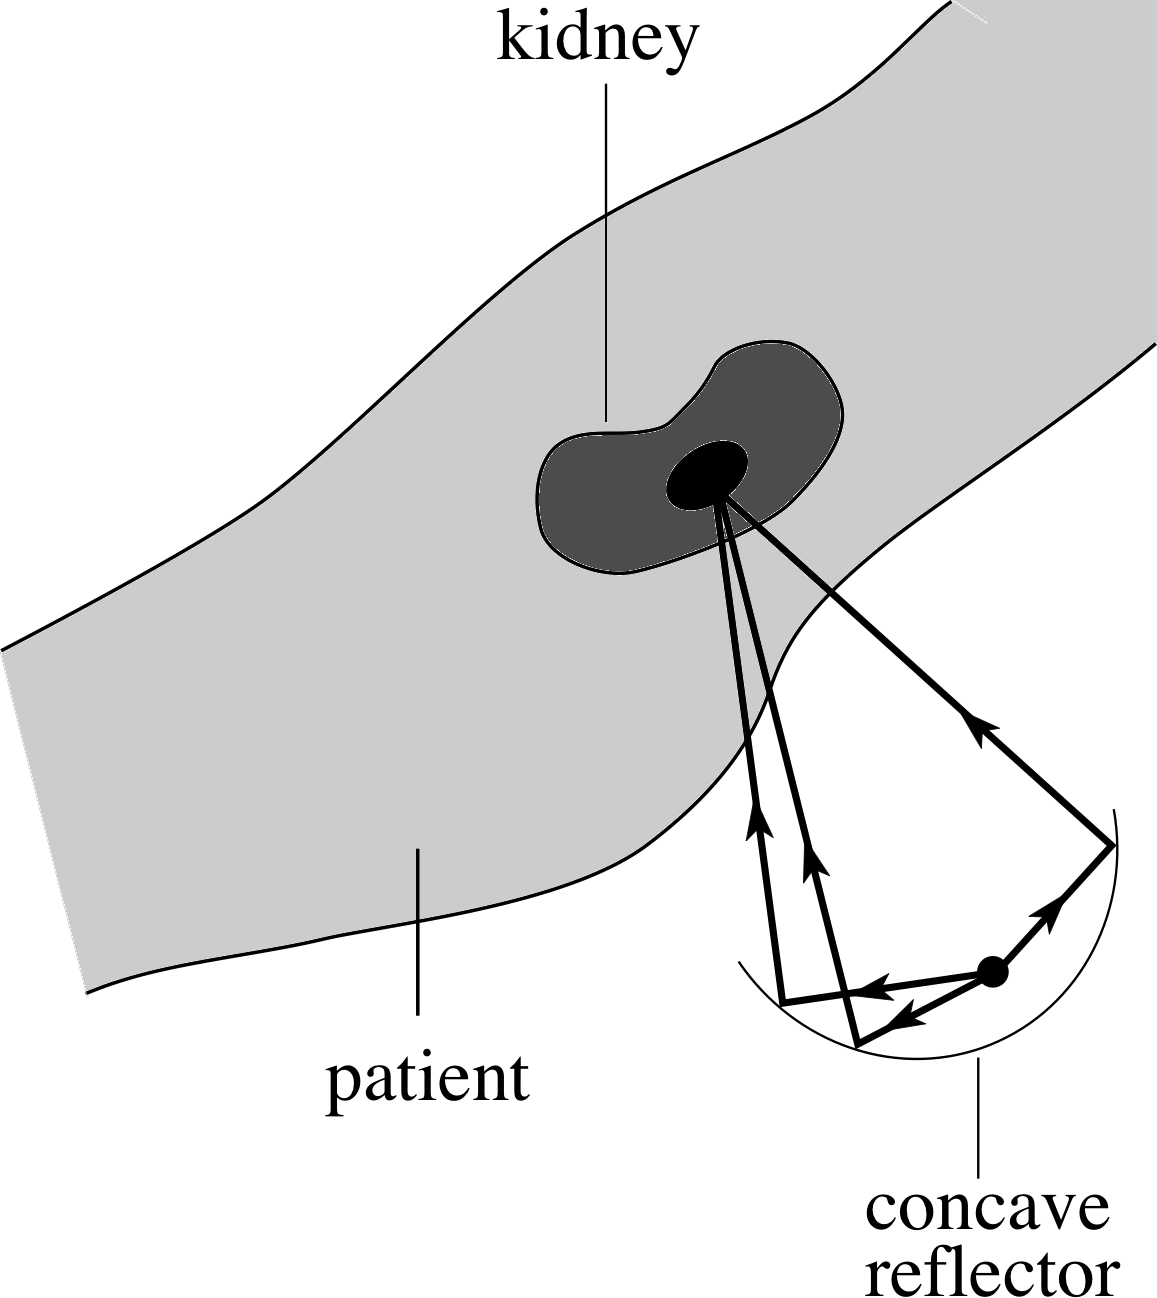
Figure 15 Schematic representation of extra–corporeal shock–wave lithotripsy.
Surgical removal of kidney stones is dangerous and expensive. ESWL (extra-corporeal shock–wave lithotripsy) is a non–surgical procedure that uses sound wave pulses focused on the stones to break them up into particles small enough to be expelled naturally by the body. A concave ellipsoidal reflector is positioned so that the stone is at one of its foci. Pulses of sound waves (from the source placed at the other focus) are reflected by it and converge on the stone. The procedure is carried out underwater, because sound travels through human tissue at approximately the same speed as it travels through water. This means that the wave pulse will be unaffected as it enters the body. This procedure is illustrated in Figure 15.

Figure 16a Refraction of sound
4.3 Refraction of sound
When a beam of sound impinges at some angle on a boundary between two media in which it has different speeds, part of it continues into the new medium, but at a different angle. This phenomenon is known as refraction. The part that continues across the boundary is therefore bent or refracted. Figure 16a shows a beam of sound impinging, at an angle θi to the normal, on the boundary between two media in which the speed of sound is υ1 in medium 1 and υ2 in medium 2, such that υ2 > υ1.
The angle of refraction, between the refracted beam and the normal, is denoted as θr. The relationship between the angles of incidence and refraction is given by Snell’s law i
Snell’s law $\dfrac{\upsilon_1}{\upsilon_2} = \dfrac{\sin\theta_{\rm i}}{\sin\theta_{\rm r}}$(13)

Figure 16b Total internal reflection.
If υ2 > υ1, it follows that sin θr > sin θi and hence θr > θr. Consequently, on moving from one medium into another in which its speed increases, the narrow beam of sound is refracted away from the normal.
If the angle of incidence is increased, the angle of refraction will also increase until sin θr reaches its maximum value of 1, at which point the angle of refraction is 90°. The angle of incidence at which this occurs is known as the critical angle and is given by
$\sin\theta_{\rm c} = \dfrac{\upsilon_1}{\upsilon_2}$(14)
When θi exceeds this critical angle no refraction occurs. This effect, known as total internal reflection, is illustrated in Figure 16b.
Question T9
From the values for the speed of sound in iron and in air given in Table 1, find the critical angle of incidence at an air–iron boundary.
Answer T9
We are given that υ2 = 5130 m s−1 and υ2 = 340 m s−2. Using Equation 14,
$\sin\theta_{\rm c} = \dfrac{\upsilon_1}{\upsilon_2}$(Eqn 14)
the critical angle of incidence at an air–iron boundary is given by
$\sin\theta_{\rm c} = \dfrac{\upsilon_{\rm air}}{\upsilon_{\rm iron}} = \rm \dfrac{340\,m\,s^{-1}}{5130\,m\,s^{-1}} = 0.067$
which gives θc = 3.8°
| Material | Speed/m s−1 |
|---|---|
| air | 340 |
| aluminium | 5100 |
| glycerol | 1860 |
| hydrogen | 1286 |
| iron | 5130 |
| steel | 5060 |
| water | 1482 |
You should remember, from Equations 3, 4 and 5,
$\upsilon_{\rm solid} = \sqrt{\dfrac{Y\os}{\rho_{\rm solid}}}$(Eqn 3)
$\upsilon_{\rm liquid} = \sqrt{\dfrac{K}{\rho_{\rm liquid}}}$(Eqn 4)
$\upsilon_{\rm gas} = \sqrt{\dfrac{\gamma P}{\rho_{\rm gas}}}$(Eqn 5)
that the speed of sound depends on both the elastic properties and the density of the material through which it travels. Therefore, if the density of a medium varies, the speed of sound can change as it travels through the medium. This explains why sound is refracted by the atmosphere. At night the air near the ground is often colder than the air higher up, as the Earth cools after sunset. Under these circumstances, the density of air decreases with height.
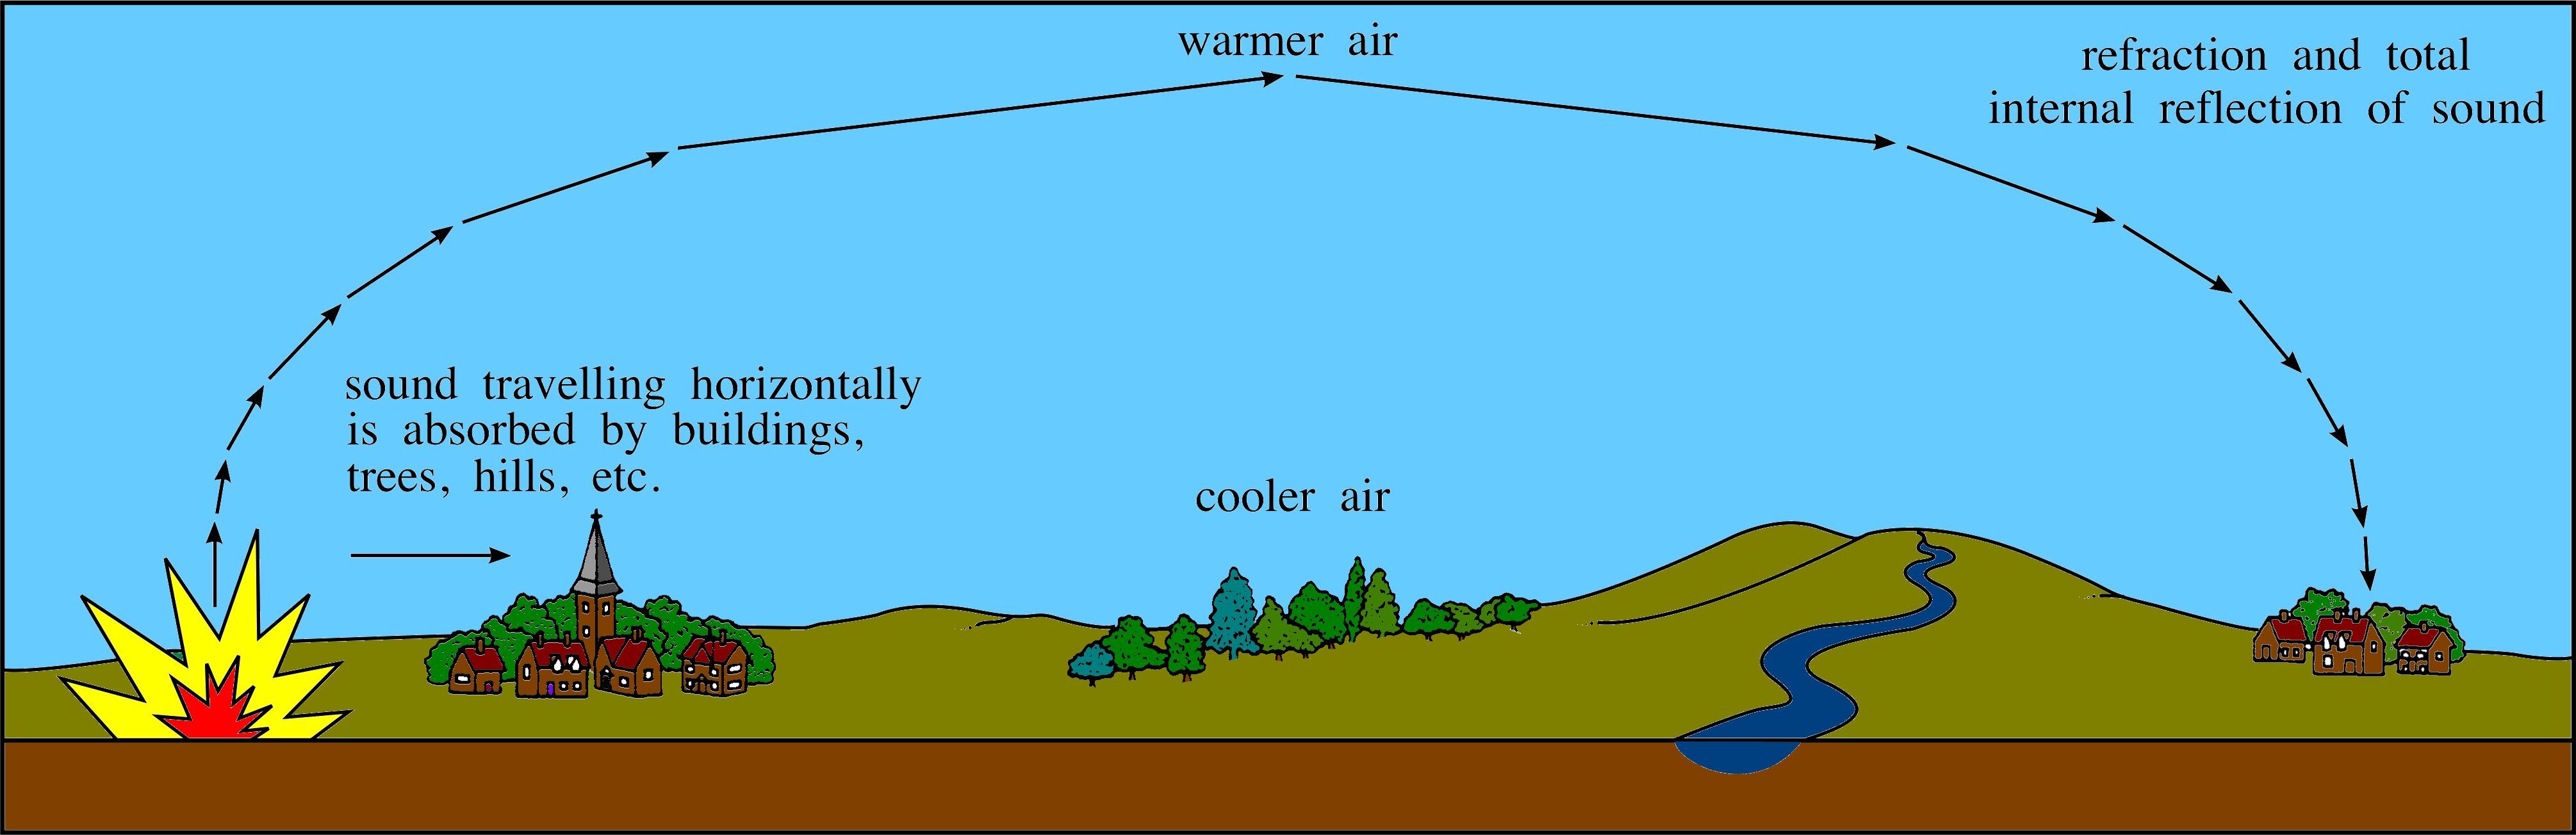
Figure 17 The internal reflection of sound by the atmosphere (not to scale). The sound is refracted as it travels through the layers of lower density air. This is shown as a stepwise process in the figure but it is in fact continuous.
If a sound wave moves upwards from a region of high air density (cool air) to one of lower air density (warm air) it is refracted away from the normal. This process continues as the sound wave moves through warmer layers of air until the critical angle is reached, at which point the sound is reflected back downwards. In this case, sound can be heard over long distances, as illustrated in Figure 17.
5 Energy and intensity of sound
5.1 The intensity of sound waves
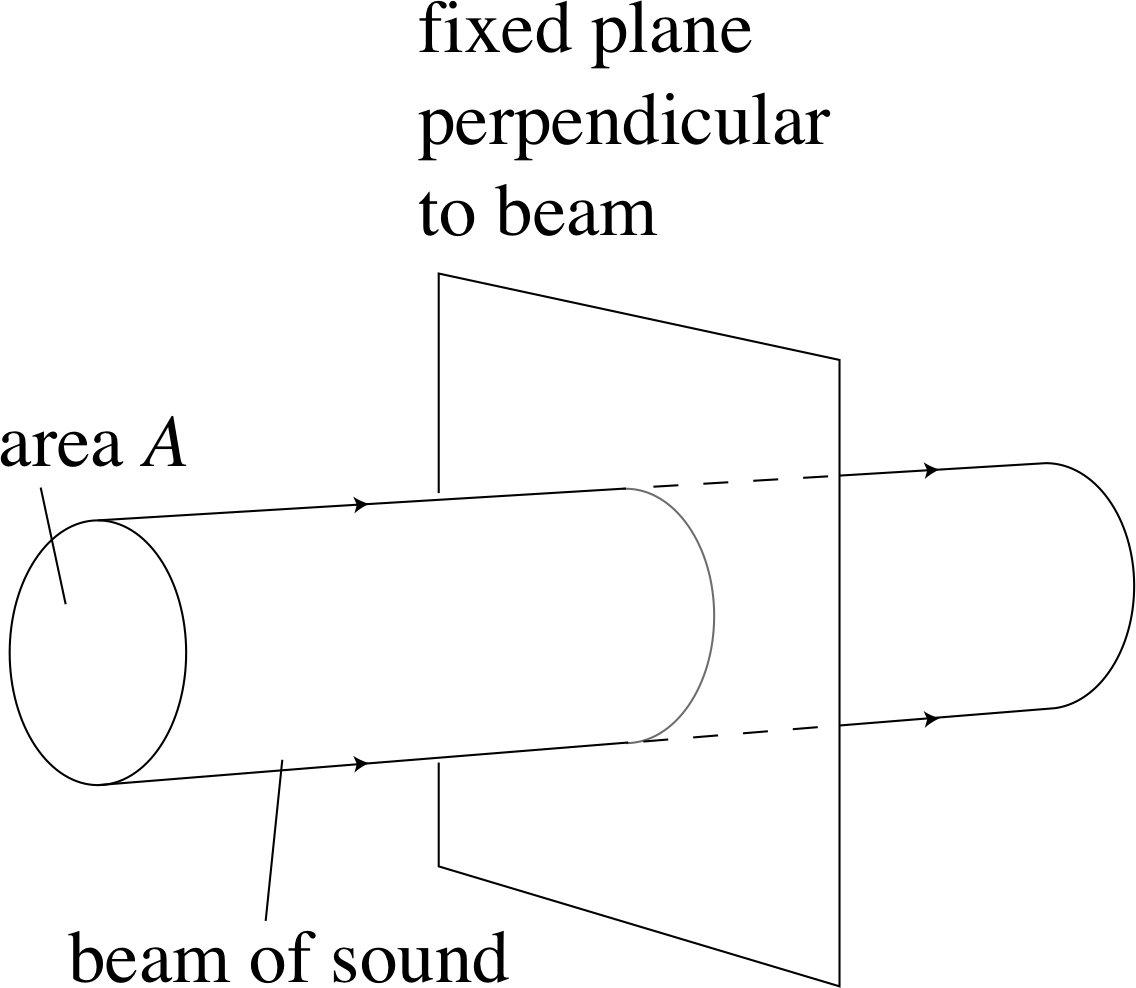
Figure 18 A parallel–sided beam of
The production of sound waves requires energy, and sound waves, as they travel, will transport that energy from one place to another. Energy being transported in this way is usually referred to as sound energy or acoustic energy. At any place along the path of the wave the acoustic energy will be stored in the medium through which the wave is moving, though its form will vary from moment to moment, and will depend on the nature of the medium. In a solid, for example, the acoustic energy will be partly accounted for by the kinetic energy of the oscillating molecules as they move back and forth and partly by the potential energy arising from their mutual interaction.
Exactly how much energy is carried by a beam of sound depends on the characteristics of the beam. To take a simple case, consider a parallel–sided beam of cross–sectional area A, composed of waves with frequency f and amplitude P0 (illustrated in Figure 18). (Remember, P0 represents the maximum excess pressure at the centre of a compression, and such a compression will move at the speed of sound υ.)
It can be shown that the rate at which such a beam transports energy, i.e. the power of the beam, measured in joules per second, is given by
power = kAP02
where k is a constant that depends on the nature and condition of the medium. i Since the beam has cross-
sectional area A it follows that the power per unit cross–sectional area (measured in joules per second per square metre) is just kP02. This quantity is usually referred to as the intensity of the beam, and denoted by the symbol I, so we can write;
$I = \dfrac{\rm power}{A} = kP_0^2$(15) i
It is interesting, and perhaps surprising, to note that the intensity depends on the square of the amplitude but is independent of the frequency. Thus, a beam of 100 Hz waves with a certain amplitude has the same intensity as a beam 10 kHz waves with the same amplitude.
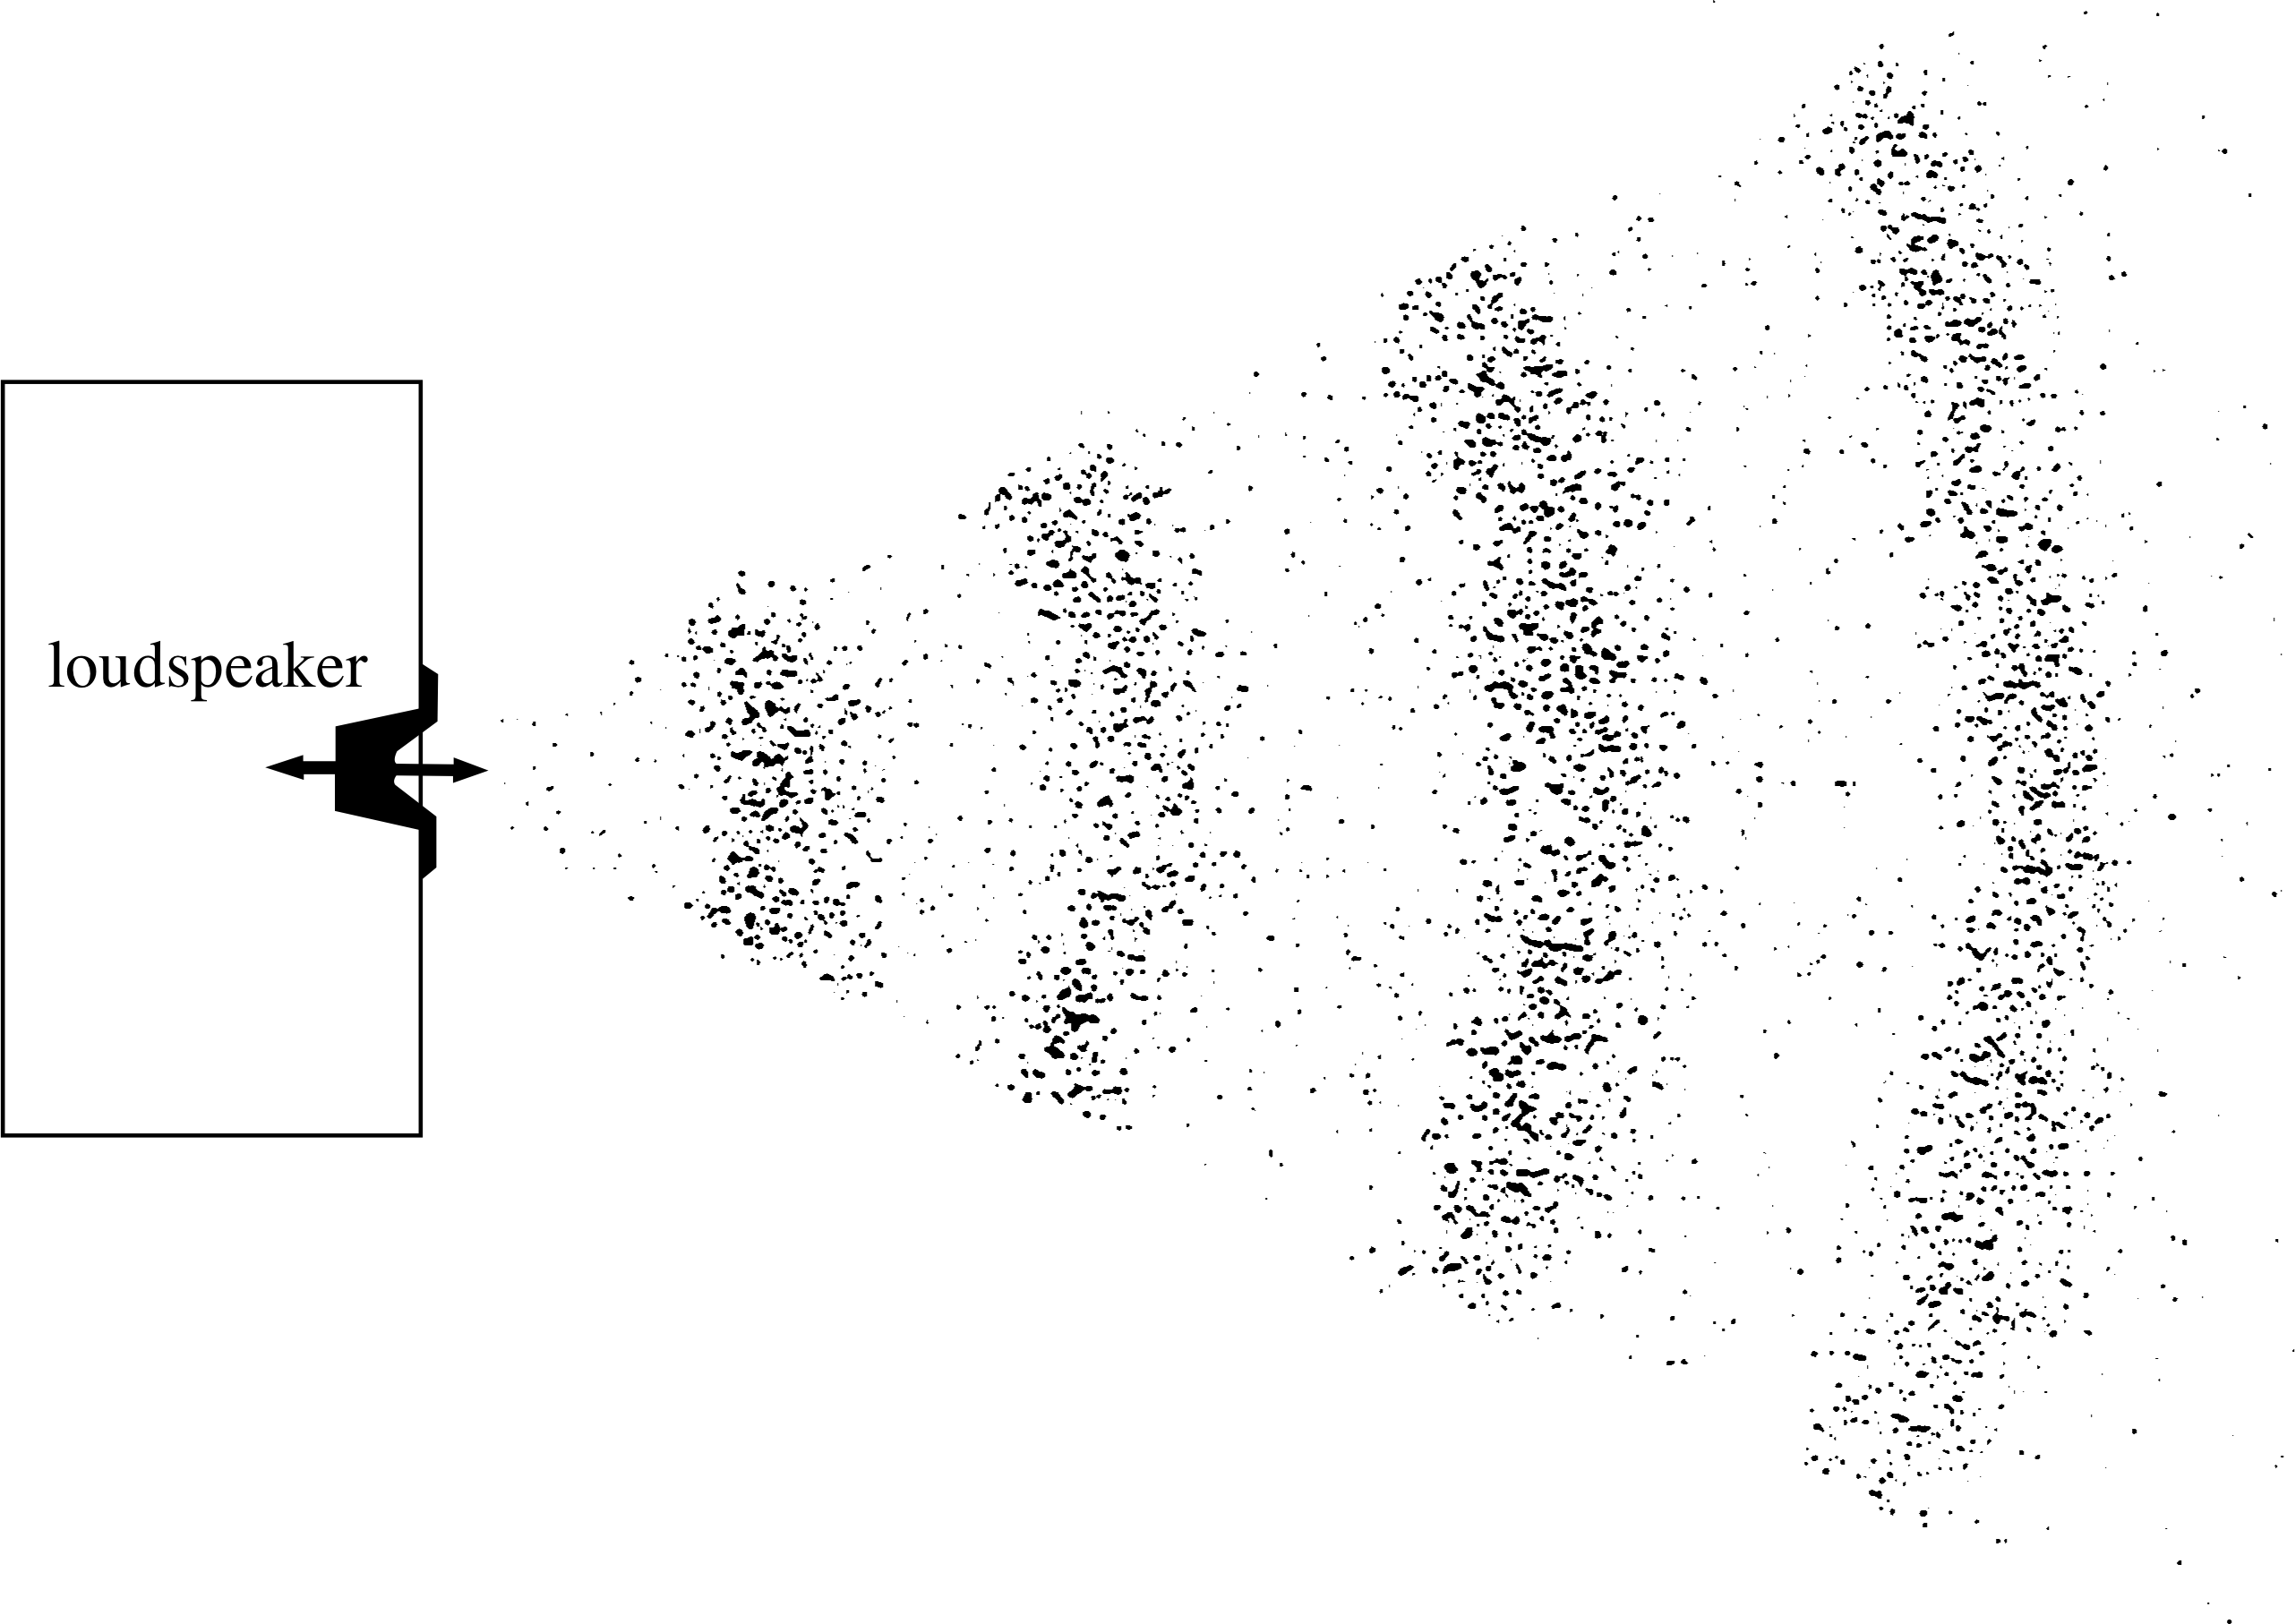
Figure 19 Sound waves spreading out from a loudspeaker.
The above considerations apply to a somewhat idealized beam of sound, but similar ideas may also be applied in more realistic situations. For instance, Figure 19 shows the sort of sound waves that would be produced by a loudspeaker. As you can see the waves do not travel in a parallel–sided beam at all; rather, they spread out in a range of different directions.
This spreading of the waves means that the energy supplied by the speaker to a given compression or rarefaction is spread over an increasingly large area as that compression or rarefaction moves away from the speaker. Thus, if we were to use a detector of fixed area A to measure the rate at which a spreading wave transports energy in its direction of propagation, our answer would depend on where we performed the measurement. Close to the speaker the power entering a detector of area A would be relatively large, corresponding to a relatively high intensity. Further from the speaker the power entering the detector would be smaller, corresponding to a lower intensity. Since the intensity varies with distance from the speaker it follows that the amplitude also varies with position in this case.
In many realistic situations the intensity also shows some degree of dependence on the frequency. For example, in many liquids acoustic energy is dissipated (i.e. lost from the wave) at a rate that depends on the square of the frequency. This ‘lost’ energy usually causes a slight heating of the medium, but the fact that the energy loss increases with frequency has a more dramatic effect on the sound itself, since it means that low frequency sounds can travel further through a liquid than can high frequency sounds. This phenomenon is put to good use by fin whales which sometimes need to communicate across hundreds of miles of ocean. The whales make a very loud noise, which is a sensible first step in long distance acoustic communication, but they do so at a very low frequency of about 20 Hz, which is an even more sensible second step!
5.2 Intensity levels and decibels
The perceived loudness of sound is partly determined by its intensity, but also depends on its frequency, and on other factors such as the age of the hearer. However, for healthy young adults the faintest sounds that can be heard at a frequency of 1000 Hz have an intensity of about 10−12 W m−2, while normal conversations involve intensities of 10−6 W m−2 or so, and sounds become painful at an intensity of around 1 W m−2.i)
In view of this wide range of intensities it is often convenient to describe a sound of intensity I in terms of a quantity called the intensity level, β, which is measured in units called decibel (dB), and defined by the relation
$\beta = 10\times\log_{10}\left(\dfrac{I}{I_0}\right)\,{\rm dB}$(16) i
where I0 = 1 × 10⁻¹² W m−2. The advantage of this scale is that the faintest audible sound has an intensity level of
$\beta = \rm 10\times\log_{10}\left(\dfrac{10^{-12}}{1\times10^{-12}}\right)\,dB = 10\times\log_{10)}(1) = 0\,dB$
normal speech has an intensity level of about
$\beta = \rm 10\times\log_{10}\left(\dfrac{10^{-6}}{1\times10^{-12}}\right)\,dB = 10\times\log_{10)}(10^6) = 60\,dB$
and the threshold of pain is at
$\beta = \rm 10\times\log_{10}\left(\dfrac{1}{1\times10^{-12}}\right)\,dB = 10\times\log_{10)}(10^{12}) = 120\,dB$
There are clear advantages to using a scale that ranges from 0 to 120 units rather than one that goes from 10−12 to 1. However, there is also the disadvantage of having to use a logarithmic scale, since an increase in intensity by a factor of ten only leads to an addition of ten dB to the intensity level.
✦ The intensity level of heavy traffic heard from street level is very roughly 70 dB. What is the intensity of the traffic noise?
✧ Since traffic noise has an intensity level about 10 dB greater than conversation it follows from the above discussion that its intensity must be about ten times that of normal speech, i.e. about 10−5 W m−2. A more general technique for finding this answer is to use the antilog10 function (the inverse of the log10 function), i since it follows from the definition of β (Equation 16), that:
$I = I_0\times10^{\beta/10\,{\rm dB}} = I_0\times{\rm antilog}_{10}\left(\dfrac{\beta}{{\rm 10\,dB}}\right)$
5.3 The inverse square law
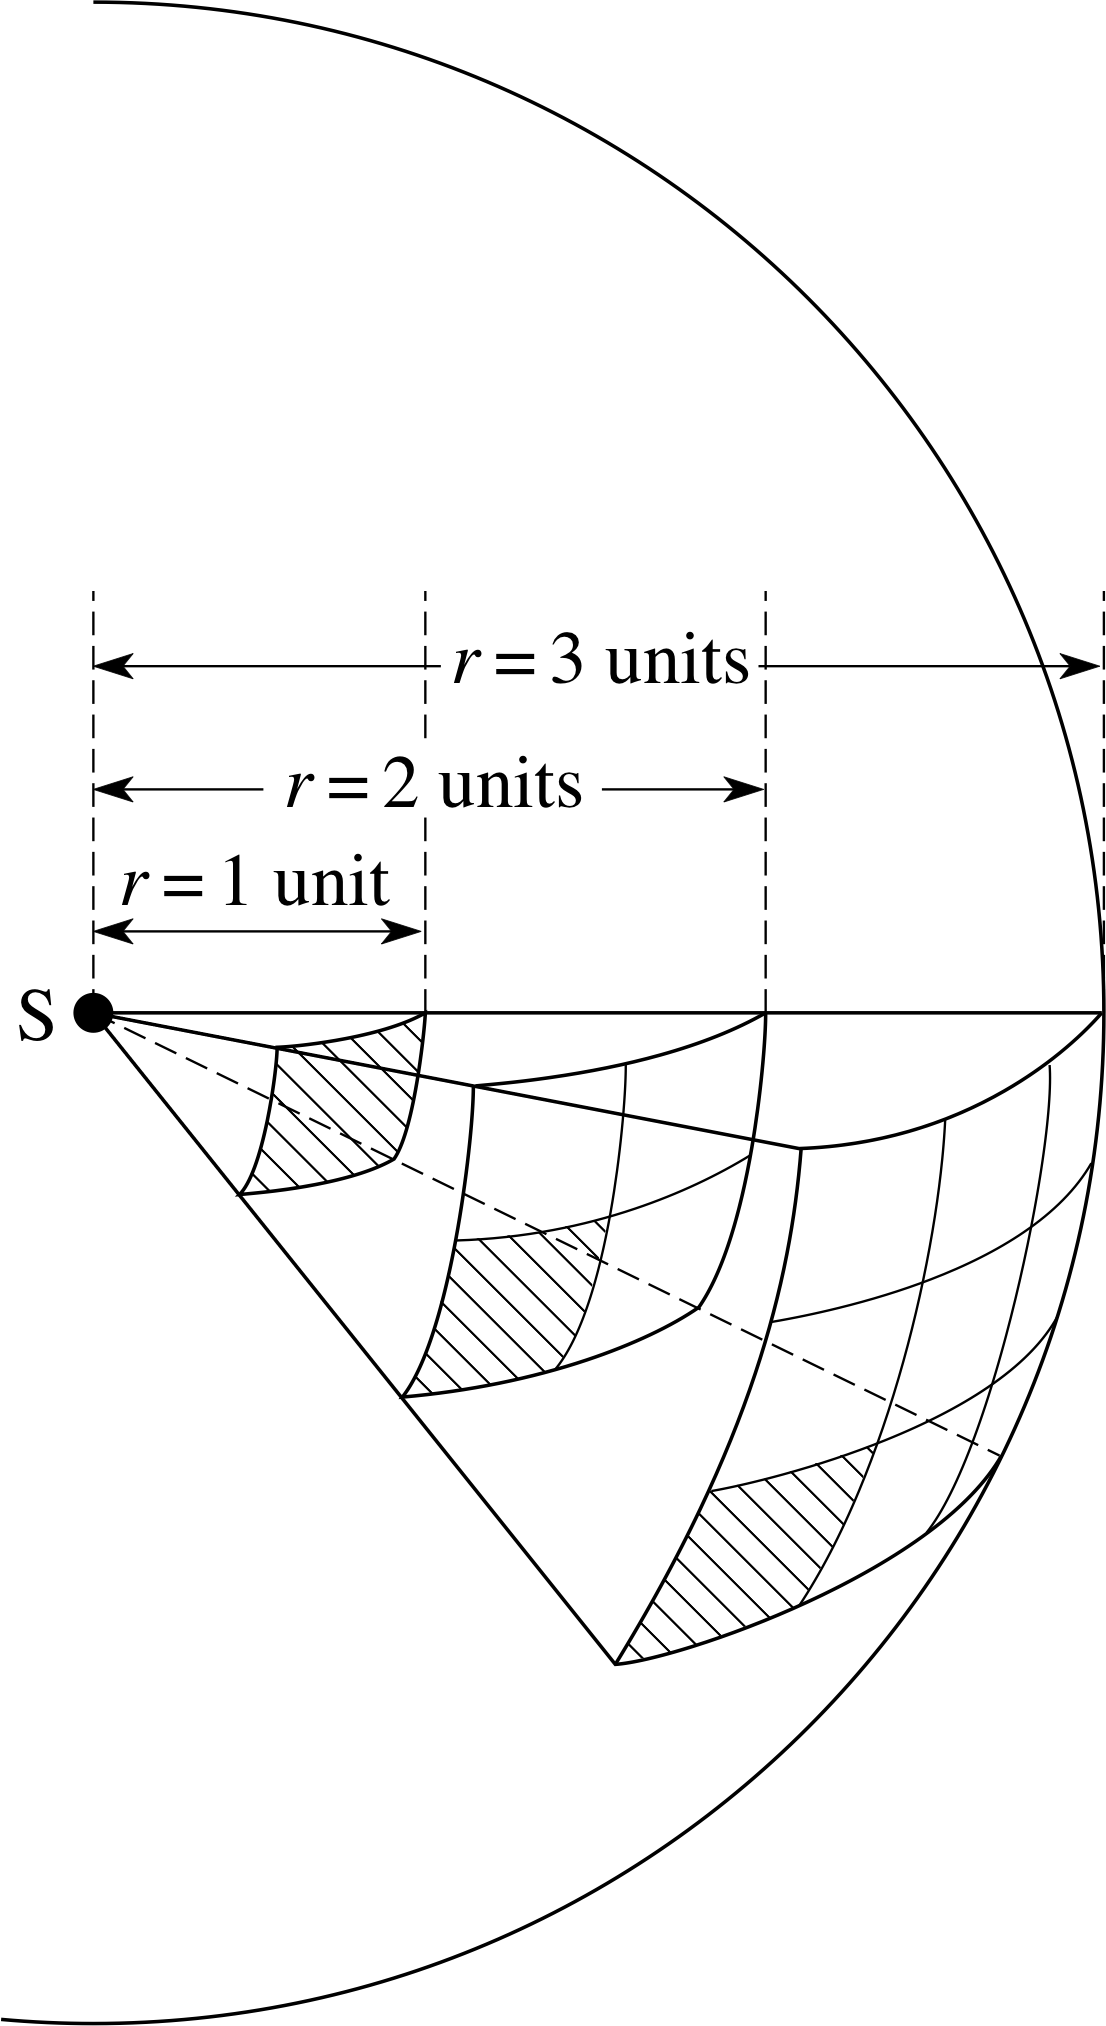
Figure 20 Sound waves spreading uniformly from a point source. As the distance
In the particular case of sound emitted uniformly in all directions from a point source, without any loss of acoustic energy due to heating, absorption or any other effect, the intensity, I, is related to the distance, r, from the source by the relation
$I \propto \dfrac{1}{r^2}$(17) i
This is an example of an inverse square law. We can see why this law applies if we consider the sound wave spreading out uniformly over the surface of a sphere (see Figure 20). The surface area, A, of a sphere, of radius r, is given by
A = 4πr2
So the area that the wave crosses increases as r2. If the intensity measured at a distance r from the source is I, it follows that the power flowing through a sphere of radius r centred on the sound source will be
I × A = I × 4πr2
If there is no loss of acoustic energy (i.e. if acoustic energy is conserved) this quantity must be independent of the value of r, so it is constant, and we can write
I × 4πr2 = constant
which gives
$I = \dfrac{\rm constant}{4\pi r^2}$
i.e.$I \propto \dfrac{1}{r^2}$
as stated earlier.
If we combine Equations 15 and 17,
$I = \dfrac{\rm power}{A} = kP_0^2$(Eqn 15)
$I \propto \dfrac{1}{r^2}$(Eqn 17)
we find that
$P_0^2 \propto \dfrac{1}{r^2}$
which gives
$P_0 \propto \dfrac{1}{r}$(18)
Thus the amplitude of the wave is inversely proportional to the distance from the source. You should bear in mind that this is only true if the wave is not obstructed, or absorbed, and if the source is small enough compared with the distances from the source to enable it to be considered as a point source emitting sound uniformly in all directions.
Question T10
A loud shout has an intensity of 8 × 10⁻⁵ W m−2 at a distance of 1 m from the source. (a) Given that the threshold of human hearing is about 10−12 W m−2 at voice frequencies, and that the sound spreads out evenly in all directions, how far away could such a shout be heard in open country? (b) What is the ratio of the amplitude of the sound wave at this distance to the amplitude 1 m from the source?
Answer T10
(a) The intensity, I ∝ 1/r2, where r is the distance from the source
We are given that I1 = 8 × 10⁻⁵ W m−2, I2 = 10−12 W m−2 and r1 = 1 m, so to find r2 from
$\dfrac{I_1}{I_2} = \dfrac{r_2^2}{r_1^2}$
Therefore$\dfrac{8\times10^{-5}\,{\rm W\,m^{-2}}}{10^{-12}\,{\rm W\,m^{-2}}} = \dfrac{r_2^2}{(1\,{\rm m})^2}$
giving us$r_2 = \sqrt{\dfrac{8\times10^{-5}}{10^{-12}}}\,{\rm m} = 9.0\times10^3\,{\rm m}$
Hence the sound could be heard about 9 km away.
(b) The amplitude of the sound wave is inversely proportional to the distance from the source of the sound. Hence
$\dfrac{P_0(\text{at 1})}{P_0(\text{at 2})} = \dfrac{r_2}{r_1}$
So the ratio of the amplitude of the sound wave at a distance of 9 km to the amplitude at a distance of 1 m is 1/9.0 × 103 = 1.1 × 10⁻⁴.
6 Interference and diffraction of sound
6.1 The superposition principle
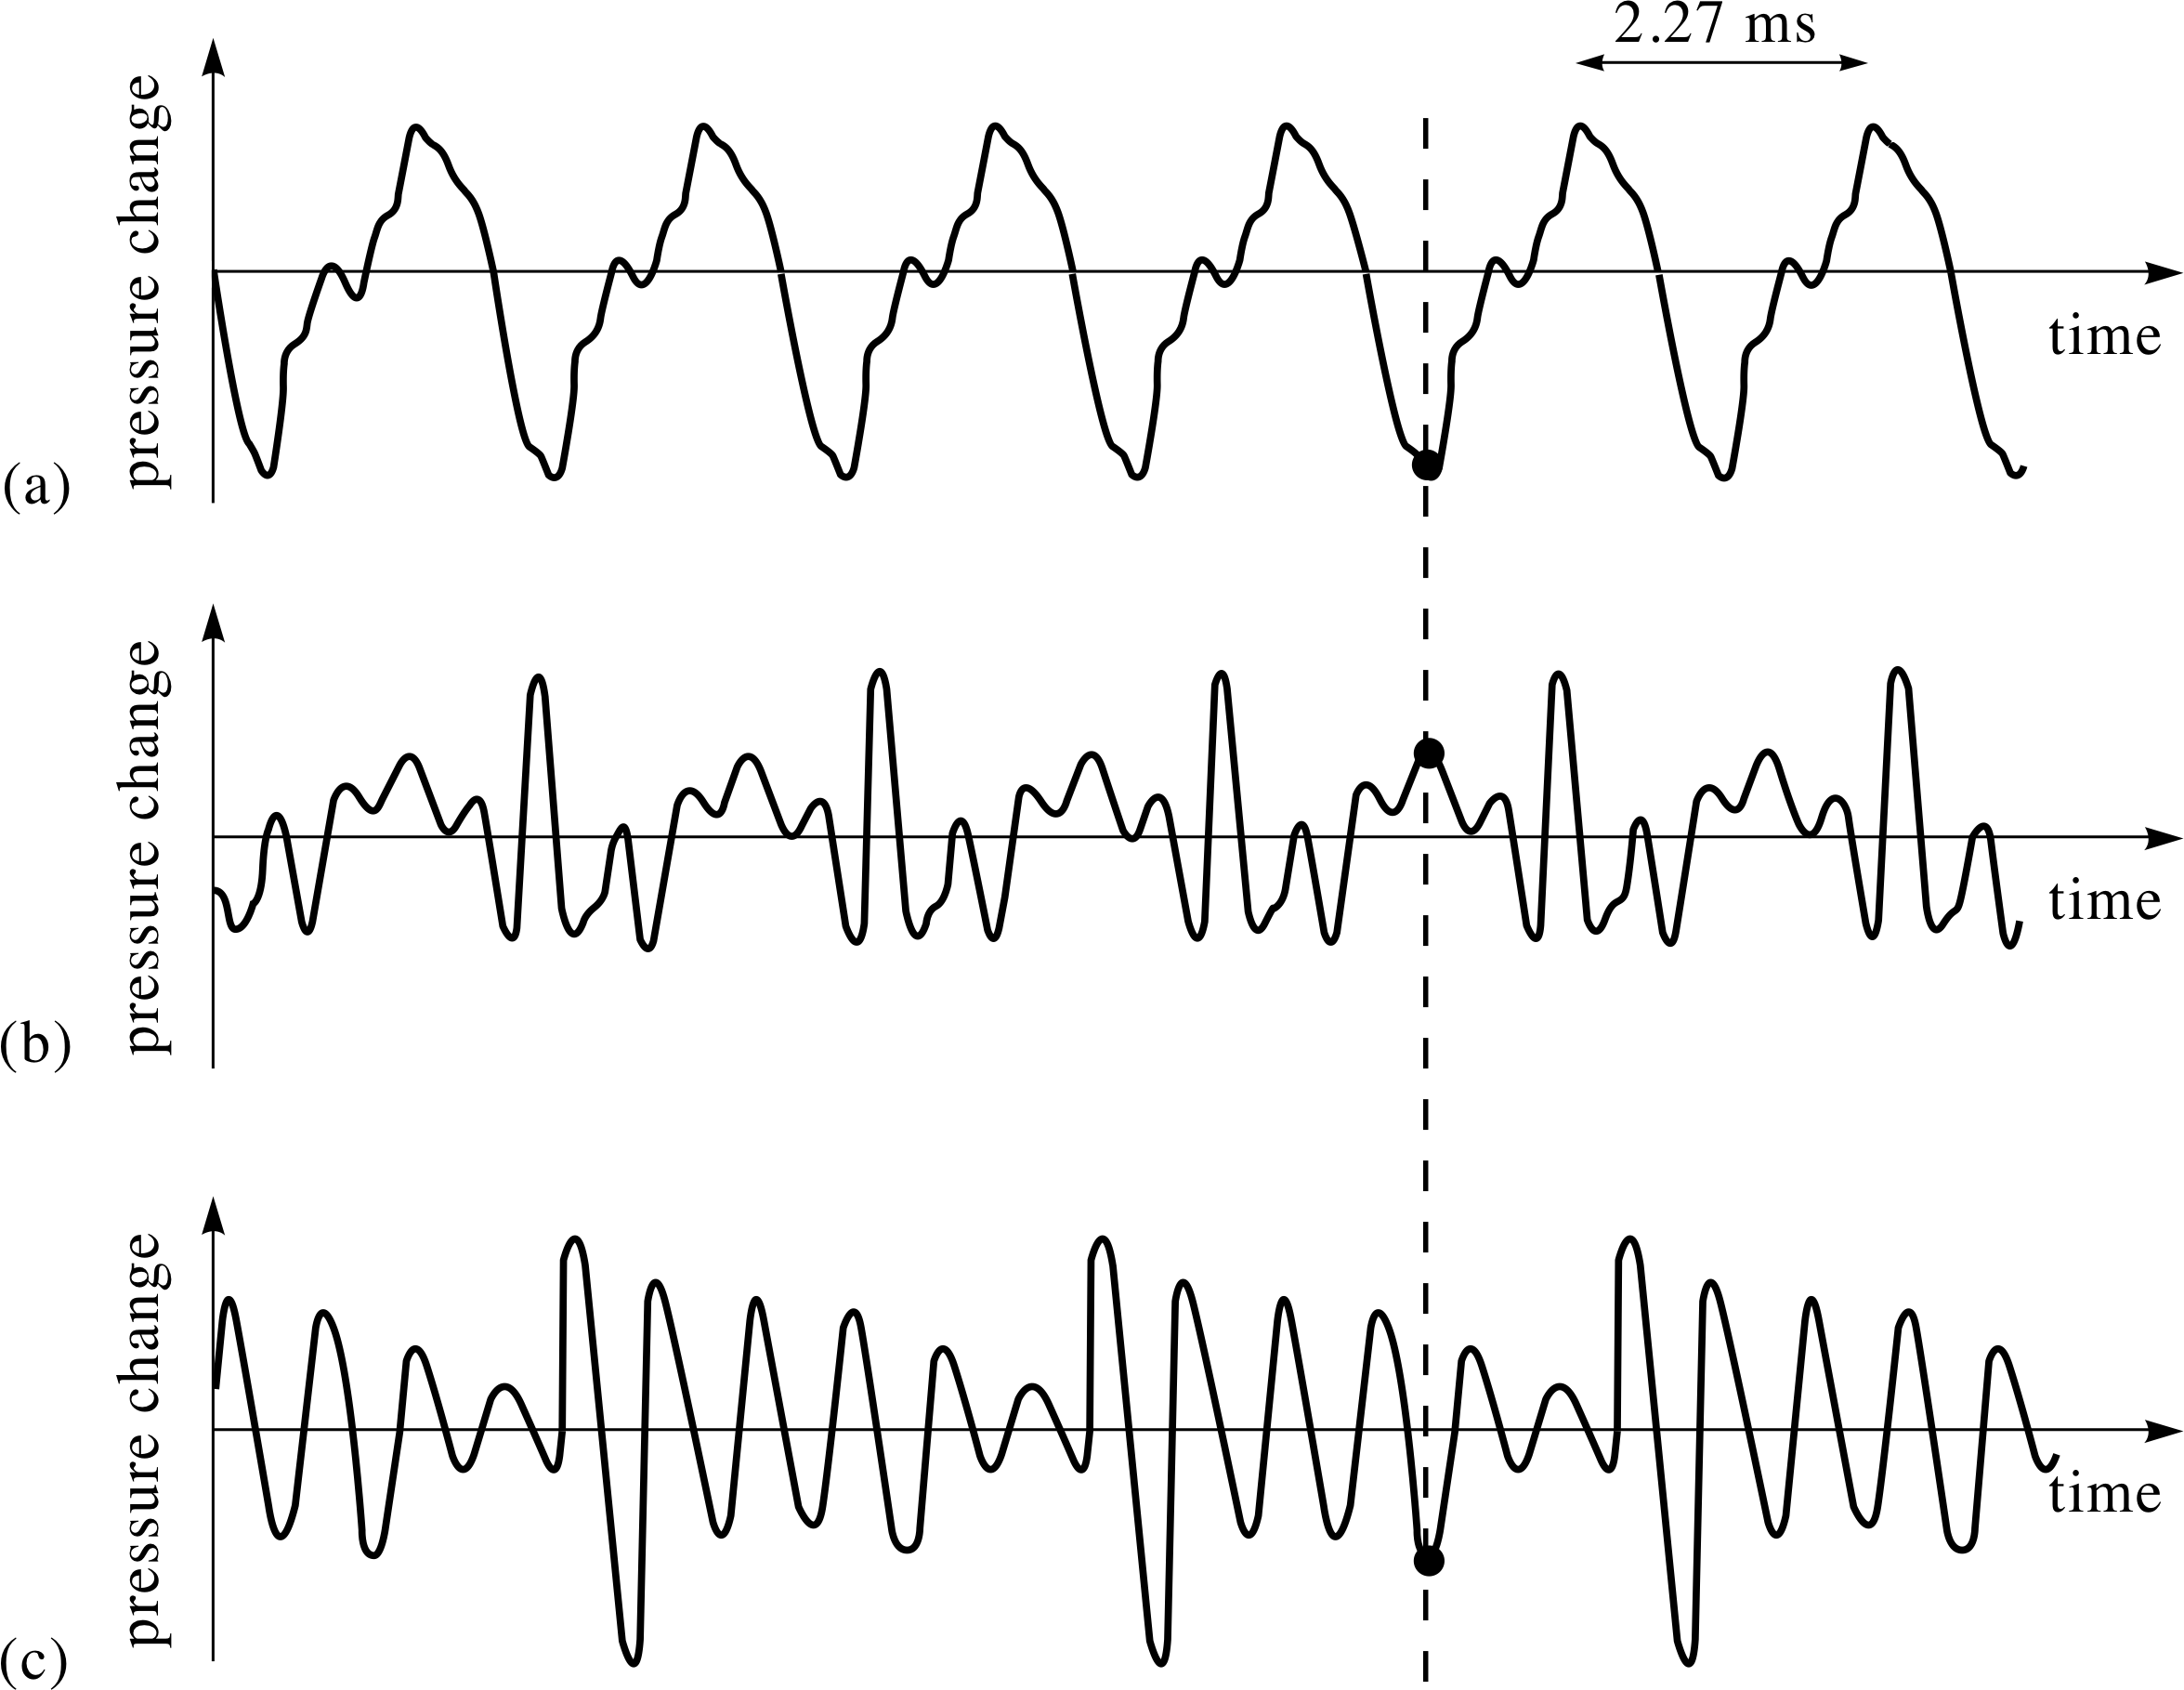
Figure 21 Pressure changes due to (a) a violin, (b) an oboe, and (c) a French horn.
In previous sections, the discussion of sound was confined to simple sinusoidal waves that can be characterized by a single wavelength (or a single frequency). In practice, of course, the pressure variations in a sound wave are rarely that simple. Even a single note played on a musical instrument has a more complicated wave form. When a violinist plays an open A–string i, the pressure at a nearby point might vary with time in the way shown in Figure 21a.
The basic period is 2.27 × 10⁻³ s, which is equal to 1/(440 Hz), showing that the fundamental frequency of the string is 440 Hz, but the wave form is far from being sinusoidal. It may actually be regarded as a sum (or superposition) of contributions of many different frequencies each of which is an integer multiple of the fundamental frequency and corresponds to one of the overtones or higher harmonics of the fundamental frequency.
This complicated wave spreads out from the violin, with an amplitude and an intensity that decrease as the distance from the violin increases.
However, this note from a single instrument is a simple wave compared with most sound waves that our ears have to cope with. We often have to listen to sound from many different sources, and the wave form from each may be even more complicated than that from the violin.
Look at Figure 21. The three graphs show the pressure variations at a particular point when a violin, an oboe and a French horn each produce a note separately. The three wave forms are different because they originate from different sources, each with a different combination of frequency components. Now suppose that the three sources produce the same notes simultaneously.
✦ How do you think that the resultant pressure variation from the three instruments playing together is related to the individual pressure variations shown in Figures 21a to c?
✧ The resultant pressure variation is simply the sum of the three individual pressure variations. At any particular time, such as that shown by the vertical dashed line, the pressure change is the sum of the pressure changes in curves (a), (b) and (c).
This last result is the consequence of the superposition principle. This powerful principle applies equally well to sound waves and to all other waves that you will encounter in FLAP. What is more, there is no limit to the number of component waves to which it applies. When listening to Beethoven’s Choral Symphony in a concert hall, the resultant pressure variation at one of your ears is the sum of hundreds of pressure variations that are produced by the instruments of the orchestra and the members of the choir separately. The combination of your ear and brain is a marvellous detector. It can unscramble a very complex pressure variation and enable you to listen to various individual components of the sound.
The superposition principle
If two or more waves meet in a region of space, then at each instant of time the net disturbance they cause at any point is given by the sum of the disturbances caused by each of the waves individually. i
6.2 Beat frequencies
Let us now consider one effect of the superposition principle. If two notes with nearly equal fundamental frequencies f1 and f2 and similar amplitudes are heard at the same time, the listener may notice that the combined sound exhibits a periodic rise and fall in intensity at a low frequency equal to the difference between f1 and f2. This is known as the phenomenon of beats. The number of times the combined sound reaches maximum intensity per second (i.e. | f1 − f2 |) is called the beat frequency.
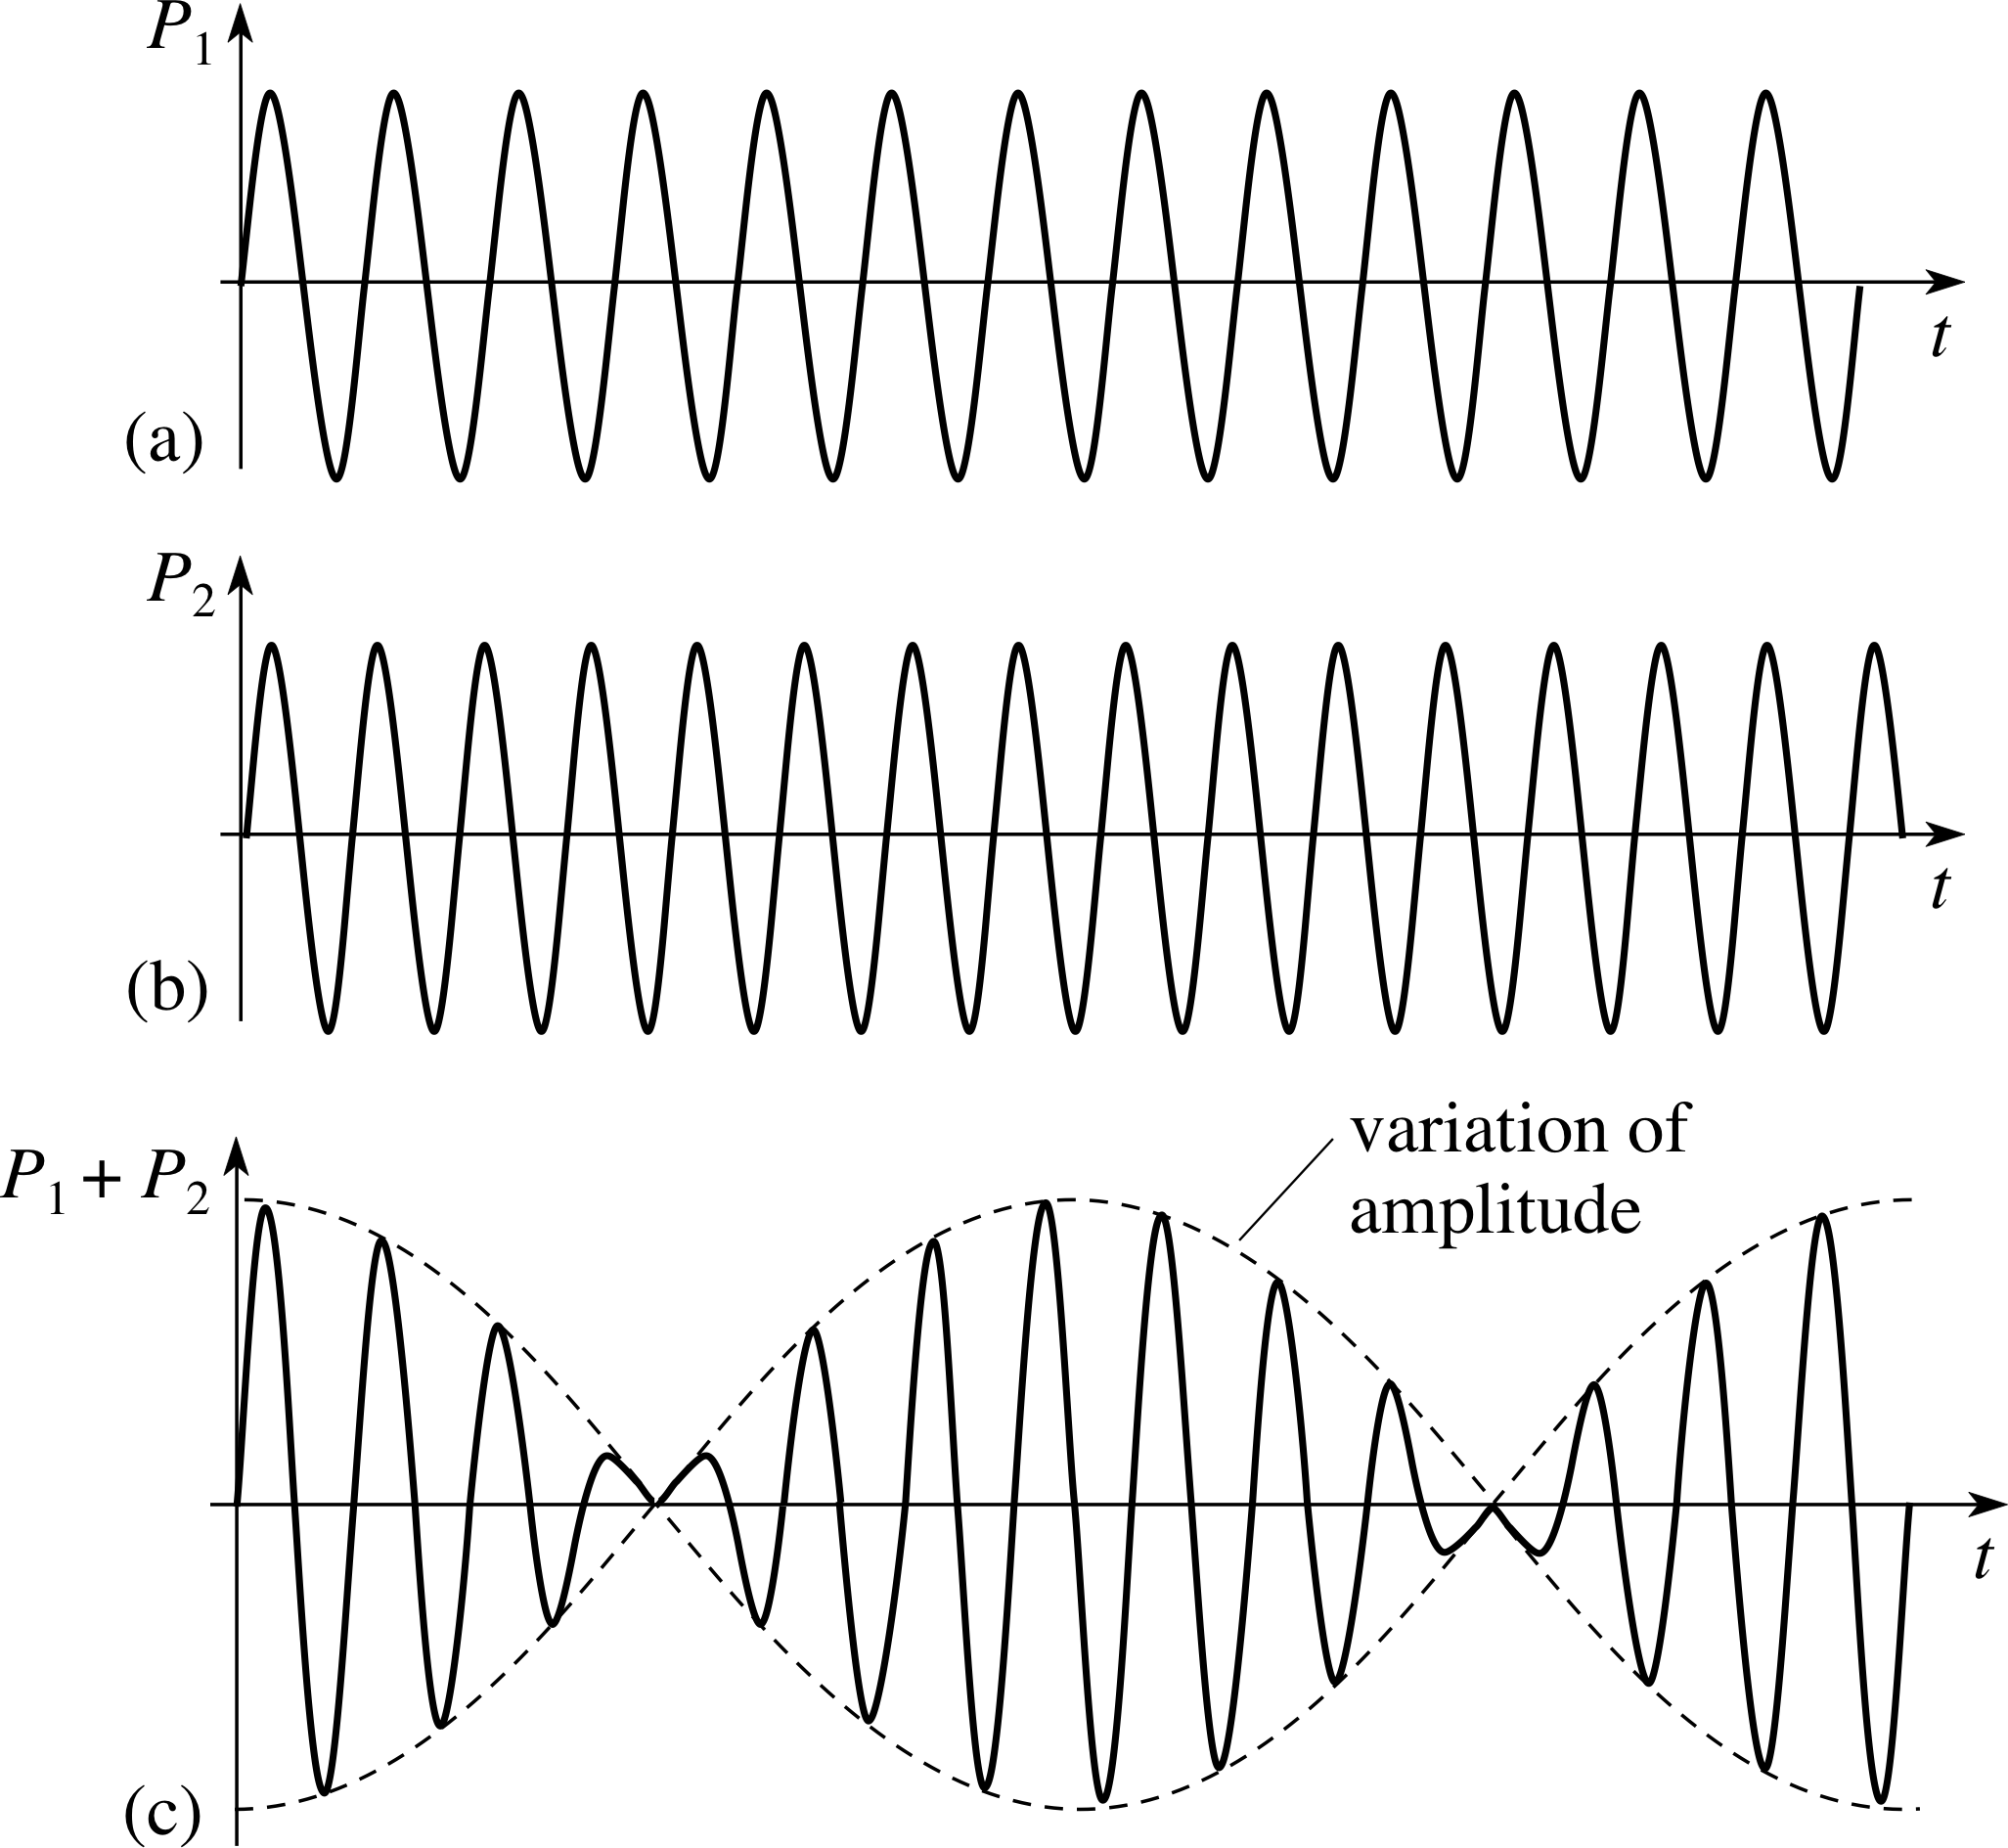
Figure 22 When two waveforms (a) and (b) with slightly different frequencies and similar amplitudes are superposed, the resulting waveform, in (c), has an amplitude that varies periodically with time. This variation would cause a listener to hear beats.
The cause of beats and the origin of the beat frequency is shown in Figure 22. The two separate notes, in this case taken to be simple sinusoidal waves, each produce similar but slightly different waveforms at the listener’s ear, as shown in Figures 22a and b. Using the superposition principle the combined effect of these two waveforms may be found by adding them together moment by moment. The result of this process is the waveform shown in Figure 22c. As you can see, the combined waveform is similar to that of the original notes, apart from the fact that its amplitude rises and falls with time.
It is this rising and falling amplitude, indicated in Figure 22c by a dashed curve, that accounts for the phenomenon of beats. The time between successive amplitude maxima will be equal to the time between successive beats.
Looking a little more carefully at Figure 22 you should be able to see that the amplitude maxima in the combined waveform occur when the two constituent waveforms match one another, both rising and falling together. When this condition is fulfilled the two constituent waveforms are said to be in phase.
This is bound to be a temporary state of affairs because the waves have different frequencies, so it is not surprising that the amplitude maxima of Figure 22c are separated by minima corresponding to times when the constituent waveforms are in anti–phase and behave in exactly opposite ways.
So, if two notes A and B have frequencies f1 and f2, where f1 is greater than f2, then in a time t note A completes f1t cycles and note B completes f2t cycles. If t is such that A completes one more cycle than B, then
f1t − f2t = 1
Therefore$t = \dfrac{1}{f_1 - f_2}$
This means that, if the two notes are initially in phase, t is the time that elapses before they are next in phase. The beat period, which is the time interval between successive in–phase situations, is given by
beat period = $\dfrac{1}{f_1 - f_2}$
which implies that the beat frequency, fb is given by:
beat frequency $f_{\rm b} = \dfrac{1}{\text{beat period}} = f_1 - f_2$(19)
In certain situations this phenomenon can be used to determine the unknown frequency of a sound wave by causing beats to occur between it and a sound wave of known frequency. i
✦ A tuning fork vibrating at 480 Hz is sounded at the same time as a certain note on a piano. The bea tfrequency produced is 5 Hz. Is it possible to calculate the frequency of the piano note?
✧ No it is not possible. The frequency of the piano note could be either 475 Hz or 485 Hz. Without further information it is impossible to determine which of the known or unknown frequencies is the higher one.
If the unknown frequency is f1 and the known frequency is f2 then either fb = f1 − f2 or fb = f2 − f1, depending on whether f1 > f2 or f2 > f1. To find out which is the higher frequency, and hence unambiguously determine the unknown frequency, we can change either the known or the unknown frequency by a small amount in a known direction, and note the change in the beat frequency.
Question T11
A tuning fork of frequency 512 Hz is sounded at the same time as a guitar string. The frequency of the beats that are heard is found to be 3 Hz. The guitar string is tightened slightly, to increase its frequency by a small amount, and the new beat frequency is found to be 4 Hz. What was the original frequency of the string?
Answer T11
We can call the guitar frequency f, therefore, from Equation 19,
beat frequency $f_{\rm b} = \dfrac{1}{\text{beat period}} = f_1-f_2$(Eqn 19)
either3 Hz = 512 Hz − f
or3 Hz = f − 512 Hz
Sof must be either 509 Hz or 515 Hz.
When the guitar frequency is increased we are told that the beat frequency also increases, i.e. the guitar frequency and the tuning fork frequency become further apart. Hence the original frequency of the guitar string must have been greater than that of the tuning fork. The original frequency must have been 515 Hz. (Had the beat frequency decreased, then the original frequency of the guitar string must have been less than that of the tuning fork.)
6.3 Interference of sound waves
In discussing beats we were concerned with what was occurring at a fixed point in space (the location of the listener’s ear) as a function of time. That is why we were able to use simple waveforms (plots of wave disturbance against time, at a fixed point) to explain the phenomenon. However, there are many situations in which we are interested in the superposition of waves at many different points simultaneously. These considerations lead us to the phenomenon of interference in which we are concerned with the way in which waves from different sources, when superposed, may reinforce or cancel one another at different locations. i
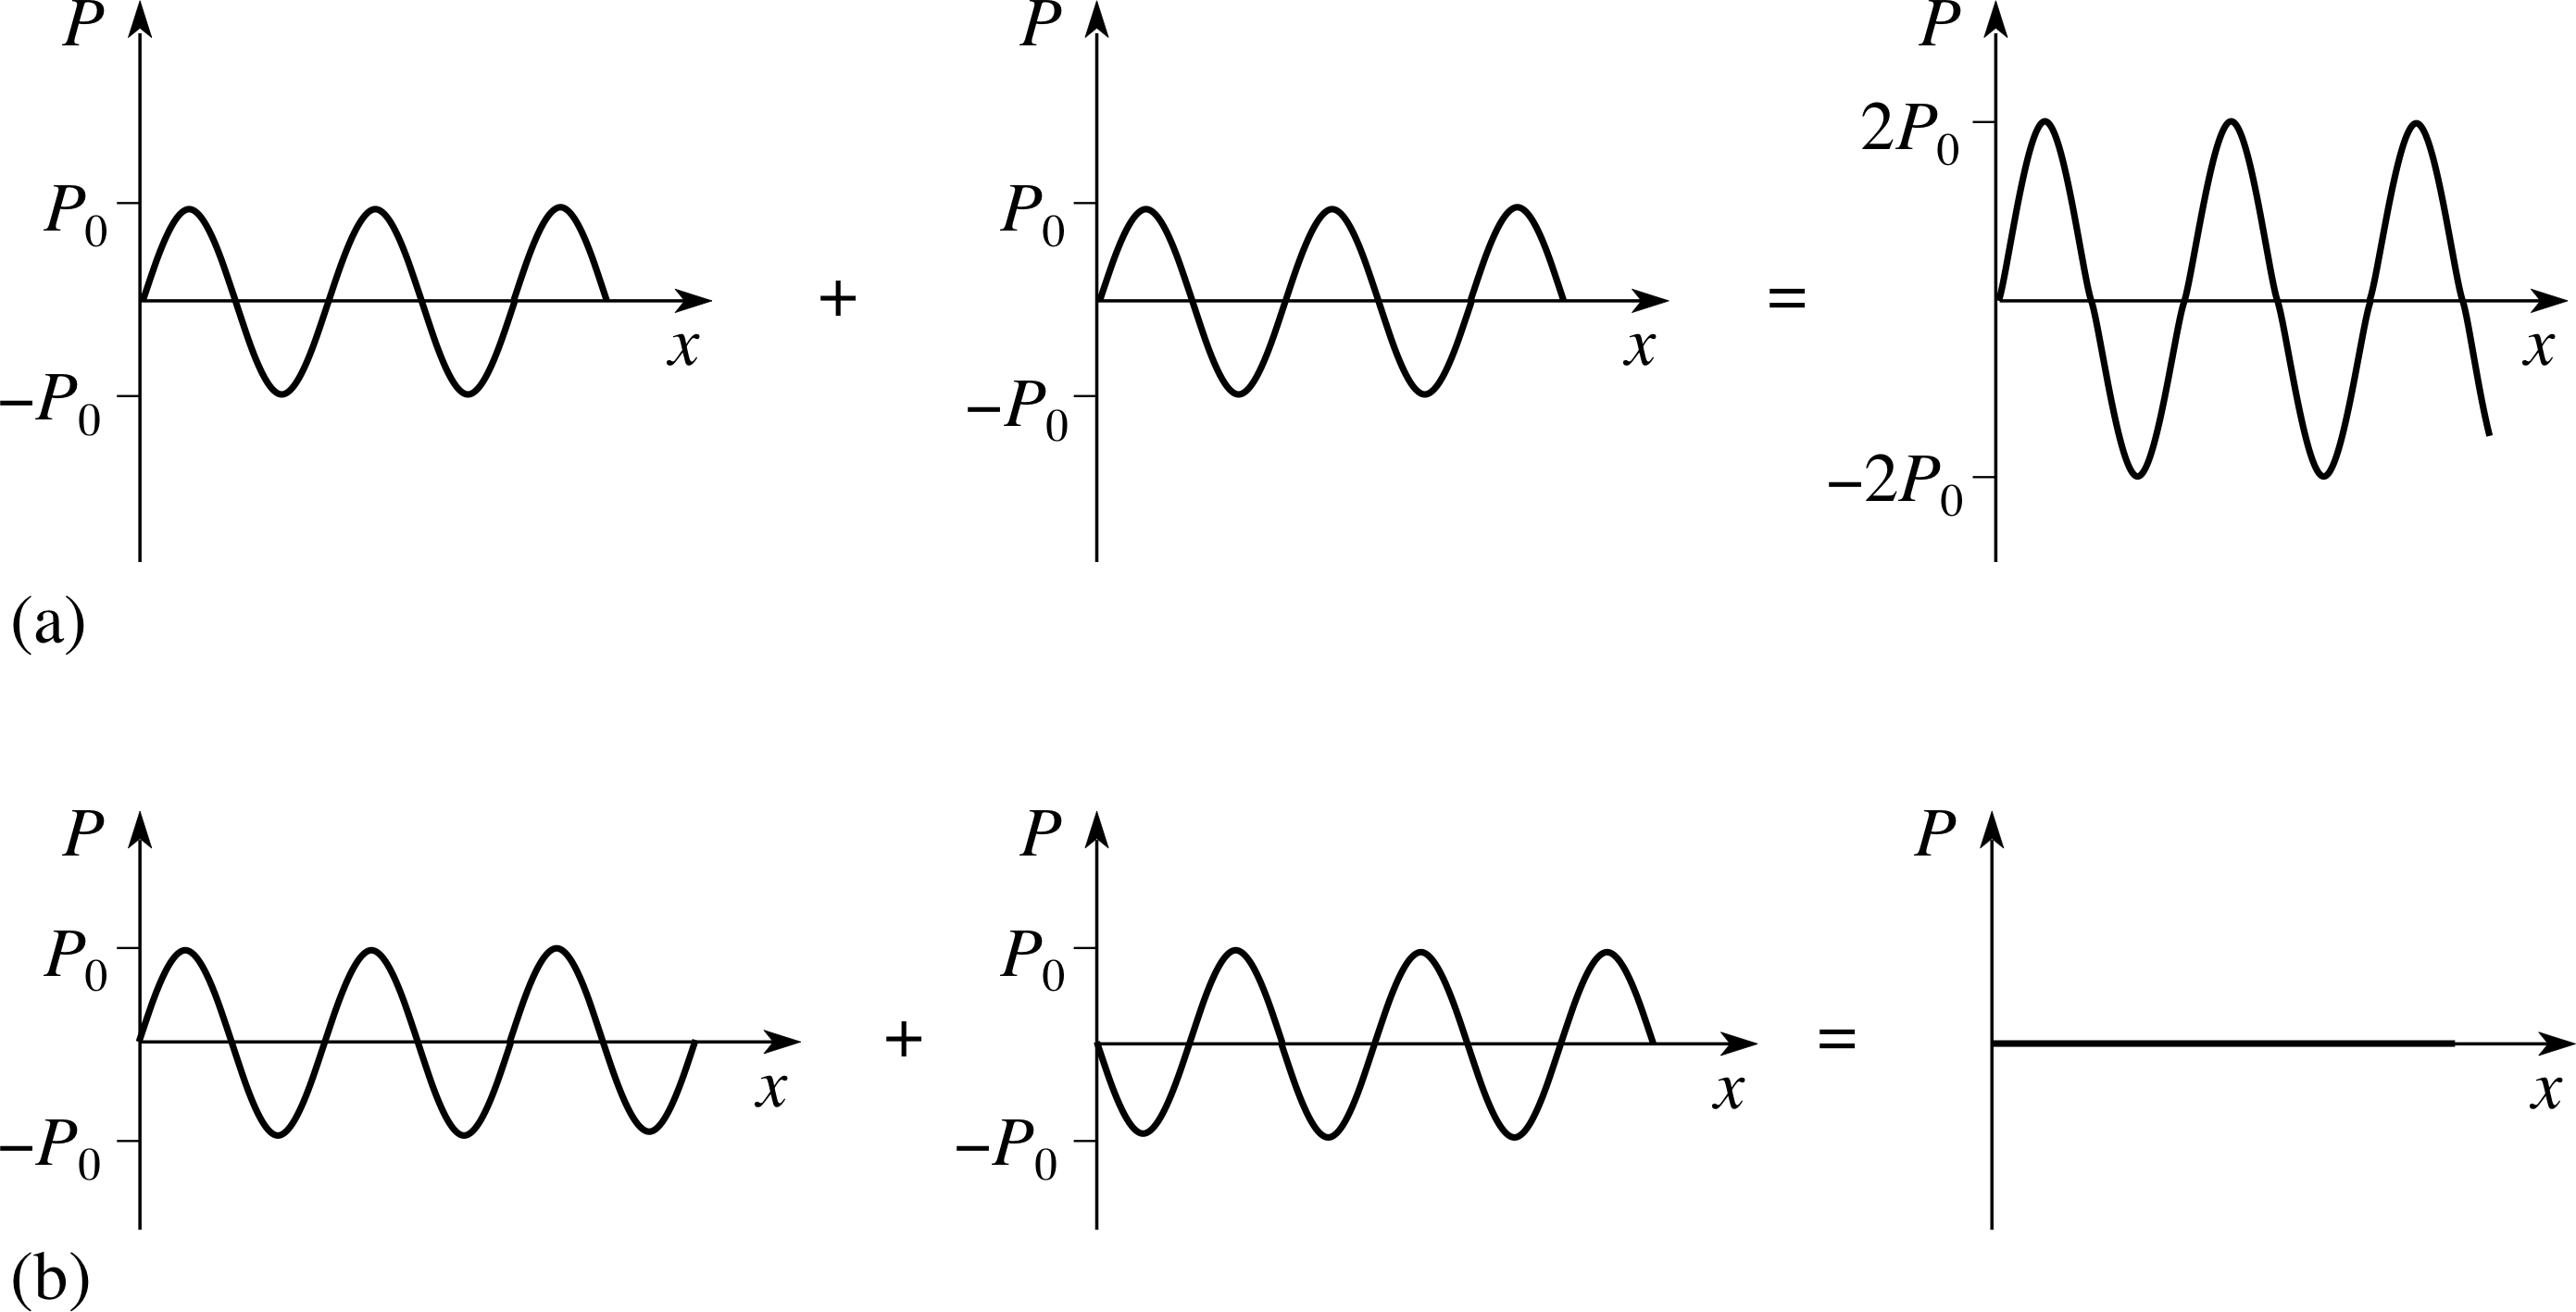
Figure 23 (a) Totally constructive interference. (b) Totally destructive interference.
Two extreme examples of interference that are particularly interesting arise when two sound waves with exactly the same amplitude and wavelength travel along the same path. These cases are shown in Figure 23.
In Figure 23a, the two waves are in phase with each other at every point, and, because their frequencies are the same, they remain in phase at all times. As a result the waveform at any point along the common path of the waves has the same frequency as the original waves but twice the amplitude.
This means that if we were to take a snapshot of the pressure distribution along the whole wave at a particular moment it would have the form shown indicated by the combined profile in Figure 23a. This is an example of totally constructive interference. In less extreme cases, where the waves were not exactly in phase at all points, the amplitude of the combined wave would be greater than that of the separate waves, but it would not be equal to their sum.
The other extreme case, shown in Figure 23b, is when the two waves are exactly 180° out of phase (i.e. in anti-phase) with each other. In this case, the resultant wave has zero amplitude everywhere, and this is known as totally destructive interference. Once again, less extreme cases can also arise.
Generally speaking, if sound waves of identical amplitude and frequency from two (or more) separate sources pass through the same region of space they will interfere and produce a pattern of interference throughout that region. Within the region there will be places where destructive interference ensures relative silence, and others where constructive interference causes an increase in intensity. This is the basis of various commercial ‘sound eaters’ designed to provide those in noisy environments with a certain amount of peace and quiet by bombarding them with even more sound. i The price to be paid is that of increased noise (due to constructive interference) elsewhere.
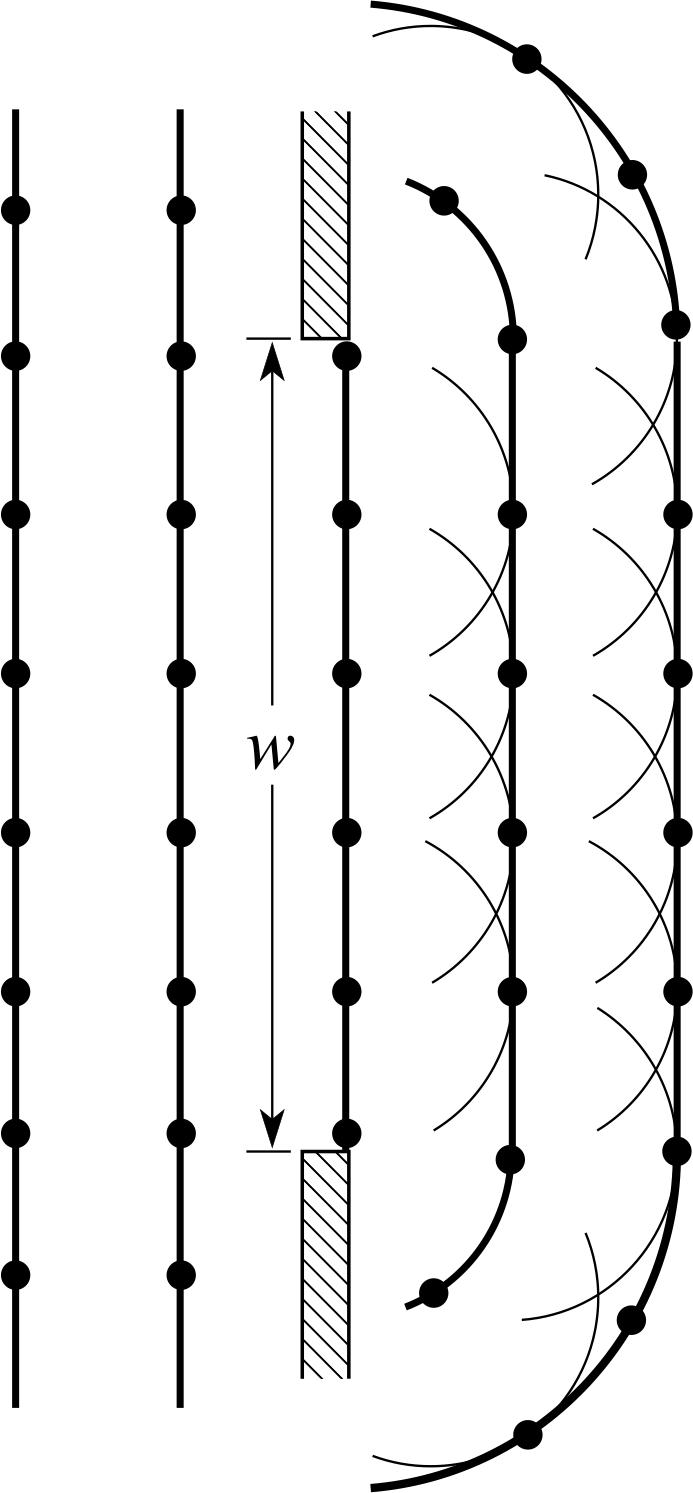
Figure 24 A simplified view of the cause of diffraction.
6.4 The diffraction of sound waves
You probably know from experience that you can hear somebody talking when they are on the far side of a tree, or some other obstruction that sound cannot easily pass through. This indicates that sound can spread around obstructing objects. This ‘bending’ of sound waves (or any other type of wave) around obstacles is known as diffraction. This phenomenon is described in more detail elsewhere in FLAP and you should consult the Glossary for details. However, it is interesting to note that even this common phenomenon requires the use of the superposition principle if it is to be properly w understood.
Figure 24 shows uniformly distributed sound waves arriving at an open doorway of width w. Each part of the compression (wavefront) arriving at the opening can be regarded as a source of more waves that will spread out in all directions. These spreading waves will interfere on the far side of the opening to produce the sound wave that actually passes into the room beyond the door. i Working out the details of this pattern of diffracted sound is quite challenging, but in crude terms it is easy to convince yourself that the resulting pattern will look something like that shown in Figure 24.
Diffraction is most noticeable when the dimensions of an obstacle, or a gap through which the wave passes, are of a similar size to the wavelength of the wave.
7 Closing items
7.1 Module summary
- 1
-
Waves in which the particles of the transmitting medium are displaced back and forth along the direction of propagation are known as longitudinal waves. Such waves consist of an alternating pattern of compressions and rarefactions.
- 2
-
A sound wave is a particular type of longitudinal wave, propagated through a material by the oscillation of molecules about their mean positions, that can transfer of energy from place to place. One characteristic of such a wave is the maximum excess pressure P0 that it causes at any point: this is known as the amplitude of the wave.
- 3
-
The wavelength λ of a sound wave is the distance between successive points of maximum pressure (or density). The period T is the time required for two consecutive maxima of pressure (or density) to pass a fixed point. The frequency f (measured in hertz) is the rate at which maxima of pressure (or density) pass a fixed point and is given by f = 1/T. It follows that the speed of propagation is given by
υ = f λ(Eqn 2)
The speed of sound in air is around 340 m s−1, and the range of audible sound frequencies is roughly 20 Hz to 20 kHz.
- 4
-
Sound requires a medium for its transmission and can therefore travel through solids, liquids and gases, but not through a vacuum.
- 5
-
The speed with which a sound wave is propagated depends on the elasticity and the density of the medium. The speed of sound through a thin solid rod is given by:
$\upsilon_{\rm solid} = \sqrt{\dfrac{Y\os}{\rho_{\rm solid}}}$(Eqn 3)
where Y is Young’s modulus for the solid and ρsolid is its density. For a liquid the corresponding equation is:
$\upsilon_{\rm liquid} = \sqrt{\dfrac{K}{\rho_{\rm liquid}}}$(Eqn 4)
where K is the bulk modulus for the liquid and ρliquid is its density. The equation for the speed of sound through a gas is:
$\upsilon_{\rm gas} = \sqrt{\dfrac{\gamma P}{\rho_{\rm gas}}}$(Eqn 5)
where γ is a constant, P is the pressure of the gas and ρgas is its density.
- 6
-
The Doppler effect is the phenomenon in which the observed frequency of a sound wave is influenced by the relative motion of the sound source and the observer. The frequency is increased when the source and the observer approach each other, and the frequency is decreased if the source and the observer are getting further apart.
When the source of sound is moving with a speed υsource relative to the stationary medium, the observed frequency fobs is related to the source frequency fsource by
$f_{\rm obs} = f_{\rm source}\left[\dfrac{1}{1\mp\left(\left.\upsilon_{\rm source}\,\middle/\upsilon_{\rm sound}\right.\right)}\right]$(Eqns 7 and 8) i
When the observer is moving with a speed υobs, the observed frequency fobs is related to the source frequency fsource by
$f_{\rm obs} = f_{\rm source}\left(1\pm\dfrac{\upsilon_{\rm obs}}{\upsilon_{\rm sound}}\right)$(Eqns 10 and 11) i
- 7
-
Sound waves in air can be reflected by solid obstacles, in which case the law of reflection applies. The angle of incidence, θi, is equal to the angle of reflection, θR.
- 8
-
Sound waves may be refracted, or changed in direction, when they travel from one medium to another. The relationship between the angles of incidence, θi, and refraction, θr, is given by Snell’s law:
$\dfrac{\upsilon_1}{\upsilon_2} = \dfrac{\sin\theta_{\rm i}}{\sin\theta_{\rm r}}$(Eqn 13)
where υ1 and υ2 are the speeds of sound in the first and second medium, respectively.
- 9
-
The intensity, I, of a wave at a given position is proportional to (amplitude)2 at that position, and is defined as the amount of energy transported by the wave per unit time per unit area perpendicular to the direction of motion. Its units of measurement are J m−2 s−1 or W m−2.
- 10
-
The intensity level β, measured in decibels (dB), of a wave of intensity I is given by
$\beta = 10\times\log_{10}\left(\dfrac{I}{I_0}\right)\,{\rm dB}$(Eqn 16)
where I0 = 1 × 10⁻¹² W m−2
Audible but non–painful sounds range from about 0 dB to 120 dB.
- 11
-
The intensity of sound falls off with distance from the source, r, according to an inverse square law. That is
$I \propto \dfrac{1}{r^2}$(Eqn 17)
Consequently, the amplitude obeys the relation
$P_0 \propto \dfrac{1}{r}$(Eqn 18)
- 12
-
The superposition principle (for waves) states that:
If two or more waves meet in a region of space, then at each instant of time the net disturbance they cause at any point is given by the sum of the disturbances caused by each of the waves individually.
The waves in a given region may therefore reinforce each other or even cancel each other out – an effect known as interference.
- 13
-
When two sound waves of similar frequency and amplitude are superposed, beats may be heard. The beat frequency is given by
fb = f1 − f2(Eqn 19)
where f1 − f2 are the two sound frequencies concerned (assuming f1 is greater than f2).
- 14
-
When the dimensions of an obstacle, or a gap through which a sound wave passes, are of similar size to the wavelength of the sound wave, the wave may be spread out or diffracted.
7.2 Achievements
Having completed this module, you should be able to:
- A1
-
Define the terms that are emboldened and flagged in the margins of the module.
- A2
-
Explain what is meant by the term longitudinal wave.
- A3
-
Describe the nature of a sound wave and identify the characteristic features of such a wave.
- A4
-
Recall and apply the equation relating the speed of a wave to its frequency and wavelength.
- A5
-
Explain why the speed of sound in a medium depends on the modulus of elasticity and the density of the medium.
- A6
-
Recall and apply equations relating the speed of sound to the elastic properties and the density of the medium.
- A7
-
Compare the transmission of sound through solids, liquids and gases.
- A8
-
Explain the nature and cause of the Doppler effect and apply the equations that describe it.
- A9
-
Apply the laws of reflection and refraction to the specific case of a sound wave.
- A10
-
Describe applications of sound and ultrasound reflection.
- A11
-
Apply the inverse square law to the case of sound waves spreading out from a source.
- A12
-
State the superposition principle and use it to explain the phenomenon of beats. Recall and apply the equation for beat frequency.
- A13
-
Explain the circumstances under which the interference of sound waves occurs.
- A14
-
State the necessary requirement for diffraction of sound to occur.
Study comment You may now wish to take the following Exit test for this module which tests these Achievements. If you prefer to study the module further before taking this test then return to the topModule contents to review some of the topics.
7.3 Exit test
Study comment Having completed this module, you should be able to answer the following questions each of which tests one or more of the Achievements.
| Material | Speed/m s−1 |
|---|---|
| air | 340 |
| aluminium | 5100 |
| glycerol | 1860 |
| hydrogen | 1286 |
| iron | 5130 |
| steel | 5060 |
| water | 1482 |
Question E1 (A6)
Young’s modulus of aluminium is 7.0 × 10¹⁰ Pa and the bulk modulus of glycerol (a liquid) is 4.4 × 10⁹ Pa. i Using the data in Table 1 determine the ratio of the densities of aluminium and glycerol.
Answer E1
The speed of sound in aluminium, υal = 5100 m s−1 and the speed of sound in glycerol, υgl = 1860 m s−1. Rearranging Equation 3,
$\upsilon_{\rm solid} = \sqrt{\dfrac{Y\os}{\rho_{\rm solid}}}$(Eqn 3)
the density of aluminium is given by
$\rho_{\rm al} = \dfrac{Y}{\upsilon^2_{\rm al}}$
and rearranging Equation 4,
$\upsilon_{\rm liquid} = \sqrt{\dfrac{Y\os}{\rho_{\rm liquid}}}$(Eqn 3)
the density of glycerol is given by
$\rho_{\rm gl} = \dfrac{Y}{\upsilon^2_{\rm gl}}$
Therefore the ratio of the densities of aluminium and glycerol is:
$\dfrac{\rho_{\rm al}}{\rho_{\rm gl}} = \dfrac{Y/\upsilon^2_{\rm al}}{K/\upsilon^2_{\rm gl}} = \dfrac{Y\upsilon^2_{\rm gl}}{K\upsilon^2_{\rm al}} = \rm \dfrac{(7.0\times10^{10}\,Pa)\times(1860\,m\,s^{-1})^2}{(4.4\times10^9\,Pa)\times(5100\,m\,s^{-1})^2} = 2.1$
(Reread Subsection 2.3 if you had difficulty with this question.)
Question E2 (A8)
An observer on train A hears a whistle sound on train B. The observer measures the frequency of the whistle as 550 Hz, but knows that the true frequency emitted by the whistle is 500 Hz. However, the observer is unsure whether train A is moving, or train B, or both.
(a) If train B is stationary, what is the speed of train A? (b) If train A is stationary, what is the speed of train B? (c) If both trains are moving towards each other with the same speed, what is the speed of each train? (You may assume that the speed of sound in air is 340 m s−1).
Answer E2
(a) This corresponds to the case of a moving observer and a stationary source of sound. So using Equation 10:
$f_{\rm obs} = f_{\rm source}\left(1+\dfrac{\upsilon_{\rm obs}}{\upsilon_{\rm sound}}\right)$(Eqn 10)
$55\,{\rm Hz} = 50\,{\rm Hz}\times\left(1 + \dfrac{\upsilon_{\rm obs}}{340\,{\rm m\,s^{-1}}}\right)$
Hence1.1 = 1 + (υobs /340 m s−1)
Soυobs = 34 m s−1
(b) This corresponds to the case of a moving source of sound and a stationary observer. So using Equation 7:
$f_{\rm obs} = f_{\rm source}\left[\dfrac{1}{1-\left(\left.\upsilon_{\rm source}\,\middle/\upsilon_{\rm sound}\right.\right)}\right]$(Eqn 7)
$55\,{\rm Hz} = 50\,{\rm Hz}\times\left[\dfrac{1}{1-\left(\left.\upsilon_{\rm source}\,\middle/340\,{\rm m\,s^{-1}}\right.\right)}\right]$
therefore 1/1.1 = 1 − (υsource /340 m s−1)
soυsource = 31 m s−1
Notice the different values for the two situations in (a) and (b).
(c) In this case, both the source of sound and the observer are moving, but at the same speed, υ. So, using the Doppler shift equation (Equation 12):
$\dfrac{f_{\rm obs}}{f_{\rm source}} = \dfrac{1\pm\left(\left.\upsilon_{\rm obs}\middle/\upsilon_{\rm sound}\right.\right)}{1\mp\left(\left.\upsilon_{\rm source}\middle/\upsilon_{\rm sound}\right.\right)}$(Eqn 12)
$\dfrac{550\,{\rm Hz}}{500\,{\rm Hz}} = \dfrac{1+\left(\left.\upsilon\middle/340\,{\rm m\,s^{-1}}\right.\right)}{1-\left(\left.\upsilon\middle/340\,{\rm m\,s^{-1}}\right.\right)}$
Hence$1.1 - \dfrac{1.1\upsilon}{340\,{\rm m\,s^{-1}}} = 1 + \dfrac{\upsilon}{340\,{\rm m\,s^{-1}}}\quad\text{or}\quad 0.1 = \dfrac{2.1\upsilon}{340\,{\rm m\,s^{-1}}}$
So, the speed of each train is 16 m s−1.
(Reread Section 3 if you had difficulty with this question.)
Question E3 (A9)
Can total reflection of sound occur as sound travels from steel into air? Explain, with the aid of the data in Table 1.
Answer E3
The speed of sound in steel, υsteel = 5060 m s−1 and the speed of sound in air, υair = 340 m s−1. For total reflection to occur
$\sin\theta_{\rm c} = \dfrac{\upsilon_{\rm steel}}{\upsilon_{\rm air}} = \rm \dfrac{5060\,m\,s^{-1}}{340\,m\,s^{-1}}$
However this is greater than one, and since it is not possible for the sine of an angle to be greater than one, total reflection cannot occur.
(Reread Subsection 4.3 if you had difficulty with this question.)
Question E4 (A11)
The sound intensity 0.25 m away from the speakers at an open–air disco is 10−3 W m−2. How far away from the speakers should you stand in order that the music you hear has the same intensity as ordinary conversation with an intensity of approximately 3 × 10⁻⁶ W m−2, assuming that no energy is absorbed?
Answer E4
Sound intensity, I ∝ 1/r2 where r is the distance from the source. Given that I1 = 10−3 W m−2, r1 = 0.25 m and I2 = 3 × 10⁻⁶ W m−2, the distance, r2, corresponding to an intensity I2 can be found from:
$\dfrac{I_1}{I_2} = \dfrac{r_2^2}{r_1^2}$
Therefore
$r_2^2 = \dfrac{I_1\times r_1^2}{I_2} = \rm \dfrac{10^{-3}\,W\,m^{-2}\times(0.25\,m)^2}{3\times10^{-6}\,W\,m^{-2}} = 21\,m^2$
giving r2 = 4.6 m
(Reread Section 5 if you had difficulty with this question.)
Question E5 (A12)
A tuning fork of frequency 256 Hz, (bottom C), is sounded at the same time as the C string on a cello, and as a result six beats are heard every second. When the prongs of the tuning fork are lightly loaded with plasticine, to lower its frequency slightly, four beats are heard every second. What is the frequency of the cello’s C string?
Answer E5
The initial frequency of the tuning fork is 256 Hz and the frequency of the cello string is f. The beat frequency, | f − 256 Hz | = 6 Hz. Therefore the cello string has a frequency f of either 262 Hz or 250 Hz.
After loading with plasticine, the new frequency of the tuning fork is lower than its original frequency and the new beat frequency is 4 Hz. This is lower than the original beat frequency.
So, by lowering the frequency of the tuning fork, the frequencies of the cello and the tuning fork become closer together. Hence, the frequency of the cello string must be below 256 Hz, namely f = 250 Hz.
(Reread Subsection 6.2 if you had difficulty with this question.)
Question E6 (A3 and A4)
A sound wave travels through a material with a speed of 1000 m s−1. If the wavelength of the sound is 0.5 m, what are (a) the frequency f and (b) the period T of this wave?
Answer E6
(a) The speed, υ, of the wave is related to the frequency, f, and the wavelength, λ, by the relationship υ = f λ. Given that υ = 1000 m s−1 and λ = 0.5 m, the frequency of the sound wave is found from:
$f = \dfrac{\upsilon}{\lambda} = \rm \dfrac{1000\,m\,s^{-1}}{0.5\,m} = 2000\,Hz$
(b) The period of the wave is given by
$T = \dfrac1f = \rm \dfrac{1}{2000\,Hz} = 5\times10^{-4}\,s$
(Reread Subsection 2.1 if you had difficulty with this question.)
Study comment This is the final Exit test question. When you have completed the Exit test go back and try the Subsection 1.2Fast track questions if you have not already done so.
If you have completed both the Fast track questions and the Exit test, then you have finished the module and may leave it here.
Study comment Having seen the Fast track questions you may feel that it would be wiser to follow the normal route through the module and to proceed directly to the following Ready to study? Subsection.
Alternatively, you may still be sufficiently comfortable with the material covered by the module to proceed directly to the Section 7Closing items.