PHYS 7.2: Temperature, pressure and the ideal gas laws |
PPLATO @ | |||||
PPLATO / FLAP (Flexible Learning Approach To Physics) |
||||||
|
1 Opening items
1.1 Module introduction
Temperature is a word we probably hear every day of our lives: ‘The temperature must be in the nineties’; ‘Bake the cake at a temperature of 200 °C’; etc. We all have an intuitive idea of what it means, yet it is a very elusive concept to try and pin down more precisely. Most school texts describe temperature as ‘degree of hotness’ – but that is somewhat unsatisfactory. What is ‘hotness’ after all? This module will examine the idea of temperature and its measurement. In doing so we hope to provide a clear idea of its scientific meaning.
The module is also concerned with the macroscopic or bulk properties of gases. We will use the term macroscopic in this context to mean ‘on a scale sufficiently large that we do not need to worry about the behaviour of atoms or molecules’. Examples of the macroscopic properties of a gas might be its volume, pressure or density. At first glance these properties might seem unrelated to temperature but as you will see they are all intimately bound together, partly because an understanding of these properties requires an understanding of temperature and partly because monitoring such properties turns out to be an excellent method of measuring temperature.
Some basic ideas about temperature and its measurement are discussed in Section 2. Section 3 deals with the properties of ideal gases and introduces Boyle’s law, Charles’ law, the ideal gas law and the equation of state of an ideal gas. In Section 4 both themes are brought together to show how knowledge of the properties of an ideal gas leads to an absolute scale of temperature and to an accurate method of temperature measurement. This section also touches briefly on the idea of a more fundamental scale of temperature based on thermodynamic principles and describes recent recommendations for the practical definition of temperature scales.
Study comment Having read the introduction you may feel that you are already familiar with the material covered by this module and that you do not need to study it. If so, try the following Fast track questions. If not, proceed directly to the Subsection 1.3Ready to study? section.
1.2 Fast track questions
Study comment Can you answer the following Fast track questions? If you answer the questions successfully you need only glance through the module before looking at the Subsection 5.1Module summary and the Subsection 5.2Achievements. If you are sure that you can meet each of these achievements, try the Subsection 5.3Exit test. If you have difficulty with only one or two of the questions you should follow the guidance given in the answers and read the relevant parts of the module. However, if you have difficulty with more than two of the Exit questions you are strongly advised to study the whole module.
Question F1
(a) Distinguish carefully between the following temperature scales: (i) centigrade, (ii) absolute (based on a constant–volume ideal gas), (iii) Celsius, (iv) thermodynamic or Kelvin. Comment on which you regard as the most, and which the least, fundamental.
(b) Describe the procedures for calibrating a mercury-in-glass thermometer on a centigrade scale, and explain why you would not expect it to give exactly the same reading as an alcohol-in-glass or any other type of thermometer, except at the calibration points.
Answer F1
(a) (i) Centigrade scales define the freezing and boiling points of water at a pressure of 1 atm as 0° and 100°, respectively. A thermometer can be calibrated by noting the value of some thermometric property at these fixed points and assuming that a change in temperature of 1° corresponds to 1/100 of the change in the thermometric property between the two points.
(ii) The ideal–gas absolute scale of temperature is defined by the relationship
$\displaystyle T= \lim_{P_{\rm triple}\to 0}\left(\dfrac{P}{P_{\rm triple}}\right) \times 273.16\,{\rm K}$
where P is the pressure of the gas in a constant-volume gas thermometer at the required temperature T and Ptriple is the pressure of the gas in the thermometer at the triple point temperature of water.
(iii) The Celsius scale is derived from the absolute scale by:
TC/°C = T/K − 273.15
(iv) The Kelvin scale is defined by:
$\displaystyle T = \left(\dfrac{Q}{Q_{\rm triple}}\right)\times 273.16\,{\rm K}$
where Q and Qtriple refer to heat flows at the measurement temperature and at the triple point temperature of water. The Kelvin scale is regarded as the most fundamental because it is derived from thermodynamic principles and is independent of the thermometric material. Centigrade scales are least fundamental as they depend on the thermometric properties of particular materials.
(b) Refer to Subsection 2.4 for the answer to this part of the question.
Question F2
(a) State Boyle’s law and Charles’ law describing the behaviour of an ideal gas and explain how they are combined in the equation of state for an ideal gas. How is the gas constant R measured?
(b) A fixed mass of ideal gas has a volume of 0.10 m3 at a pressure of 2.0 × 10⁵ N m−2 and a temperature of 27 °C. (i) Find the new pressure if the gas is heated at constant volume to 87 °C. (ii) If the gas pressure is subsequently reduced to 1.0 × 10⁵ N m−2 at constant temperature (of 87 °C), what is the final volume of the gas?
Answer F2
(a) Boyle’s law states that for a fixed mass of gas at constant temperature the pressure is inversely proportional to the volume, so PV = constant. In its modern form, Charles’ law states that for a fixed mass of gas at constant pressure the volume is proportional to the absolute temperature, or V/T = constant. These two laws combine to give PV/T = constant. Usually this is written in the form PV = nRT, where n is the number of moles of gas and R is the universal gas constant. R is measured by determining $\dfrac{PV}{nT}$ for different quantities of gas and extrapolating to zero pressure. This is described in Subsection 3.5 and illustrated in Figure 10.
(b) (i) V is constant, so if we use $\dfrac{P_1V_1}{T_1} = \dfrac{P_2V_2}{T_2}$ we find:
$\dfrac{P_1}{T_1} = \dfrac{P_2}{T_2}$
Hence$P_2 = \dfrac{T_2}{T_1}\times P_1$
$P_2 = \rm \left(\dfrac{87+273}{27+273}\right)\times2.0\times10^5\,N\,m^{-2}$
(Remember to convert the temperature into absolute temperature.)
Therefore:
$P_2 = \rm \dfrac{360}{300}\times2.0\times10^5\,N\,m^{-2} = 2.4\times10^5\,N\,m^{-2}$
(ii) The temperature is constant so:
$P_1V_1 = P_2V_2\quad\text{so}\quad V_2 = \dfrac{P_1}{P_2}\times V_1$
P1 is now 2.4 × 10⁵ N m−2 and P2 is 1.0 × 10⁵ N m−2
so$V_2 = \rm \dfrac{2.4\times10^5}{1.0\times10^5}\times0.10\,m^3 = 0.24\,m^3$
1.3 Ready to study?
Study comment To begin the study of this module you will need to be familiar with the following terms: acceleration, atom, density, dimensions (as in dimensional analysis), electromagnetic radiation, energy, equilibrium, force, kinetic energy, mass, molecule, newtons_laws_of_motionNewton’s laws, power, scalar, spectrum, SI units, vector, velocity, volume, wavelength and work. You should also be able to use simple algebra and trigonometry. If you are unsure about any of these items then you can review them by referring to the Glossary, which will also indicate where in FLAP they are developed. The following Ready to study question will allow you to establish whether you need to review some of the topics before embarking on this module.
Question R1
An overhead traffic light of mass 20 kg hangs in equilibrium from the midpoint of a wire stretched across the road between two telegraph poles 16 m apart. At each pole, the wire makes a downward angle of 10° with the horizontal. Find the tension in the wire and the distance of the light below the suspension points on the poles. Take the magnitude of the acceleration due to gravity to be 10 m s−2.
Answer R1
The traffic light is in equilibrium, so the net force acting on it will be zero. If the traffic light has mass m and the tension in the wire is of magnitude T, then in the vertical direction the tension produces two parallel components_of_a_vectorcomponent forces, each of magnitude T sin θ (where θ is the angle the wire makes with the horizontal), and vertical equilibrium gives:
2T sin 10° − mg = 0
So$T= \dfrac{mg}{2\sin 10°} = \rm \dfrac{20\times10}{2\times0.174}\,N = 5.8\times10^2\,N$ (to two significant figures)
The distance of the light below the suspension point is equal to (8 tan 10°) m = 1.4 m (to two significant figures).
2 Temperature
2.1 The concept of temperature
We are all familiar with the idea of temperature at a very basic level. We can use our bodily senses to decide whether something is hot or cold. If we are going to use this concept scientifically we need to define it much more precisely – and that’s not as easy as you might think. When Isaac Newton (1642–1727) and his contemporaries were defining quantities such as velocity, force and work, they were able to relate them all back to the three fundamental quantities mass, length and time. However, it is not at all obvious that the same can be done for temperature.
At a microscopic level (that is to say on a scale where we consider the behaviour of atoms and molecules), it is possible to show that the temperature of a body is related to the average kinetic energy of its molecules and thus can be expressed in terms of mass, length and time. In this module, however, we are considering temperature from a macroscopic viewpoint (on a scale where we are concerned only with bulk properties of materials and not the properties of the constituent atoms or molecules). Thus we will regard temperature as a new fundamental quantity, to rank alongside mass, length and time.
One possible confusion should be put to rest immediately: temperature is not the same thing as heat even though everyday language sometimes implies that it is. For example, when we say, ‘Phew! The heat!’, we usually mean ‘Phew! The temperature’. The idea of heat is discussed fully elsewhere in FLAP, but for present purposes it is sufficient to know that heat is the name we give to energy that is transferred from one body to another in a certain way and that it therefore has the same dimensions as energy, whereas temperature does not. The following question is intended to emphasize this distinction.
✦ If you splash a small drop of boiling water onto your hand, you will feel a sharp but relatively harmless pain. But if you spill an entire cup of boiling water over your hand you will suffer agony and may incur serious injury. Since the temperature is the same in both instances, why is the second so much more harmful than the first?
✧ When the small drop of boiling water comes into contact with your hand, some heat (energy) will be transferred from the water to your hand. When the cup of boiling water is spilt this process is repeated many times over. Thus, although the temperature of the water is the same in both cases a much greater quantity of heat (energy) is transferred in the second case and this can cause considerable damage to your hand. Clearly, heat and temperature, though related, are very different.
2.2 Thermal equilibrium and the zeroth law of thermodynamics
If temperature is not the same as heat, although it is related to heat, then what is it? It turns out that the best way to think of temperature macroscopically is by considering thermal equilibrium. If you pour hot tea into a cold mug, the mug warms up and the tea cools down as heat is transferred from the tea to the mug. Eventually a state will be reached when there will be no net flow of heat from the tea to the mug. In this case we say that the tea and mug are in thermal equilibrium with each other.
In general, if two bodies are brought into thermal contact, so that heat can flow between them, it will do so until thermal equilibrium is reached. At thermal equilibrium heat flow ceases and the temperatures of the two bodies are, by definition, the same. Before thermal equilibrium is established the body from which heat flows is said to be at higher temperature than the body to which the heat flows. Thus:
Temperature is the physical quantity that determines the direction of heat flow between bodies that are in thermal contact.
This discussion of temperature might seem pedantic but it does give us a firm logical foundation from which we can develop other ideas. There is, however, a practical difficulty with what we have said so far. How can we tell whether or not two objects are in thermal equilibrium (and therefore at the same temperature) if we can’t bring them into thermal contact? For example, one object might be in London and the other in New York. The solution to fundamental problems of this sort is provided by thermodynamics, the study of energy, heat and temperature, especially in relation to the behaviour of matter. In this particular case the way forward is to assume that the following statement (known as the zeroth law of thermodynamics) is true.
The zeroth law of thermodynamics: If two bodies are separately in thermal equilibrium with a third body, then they will be in thermal equilibrium with each other.
The zeroth law might seem to be stating the obvious, but it is nonetheless of great importance. It is called the ‘zeroth law’ because it was only given the exalted status of a ‘law’ after the first, second and third laws of thermodynamics had already become established, yet in the logical development of thermodynamics it comes before the others. i
The zeroth law justifies the use of a temperature measuring device (a thermometer!) to determine whether or not objects are in thermal equilibrium with each other. Any objects which can be shown to be in thermal equilibrium with a given thermometer registering a particular temperature, will be in thermal equilibrium with each other, and will therefore be at the same temperature.
Question T1
A thermometer is placed in a mug of coffee and comes into thermal equilibrium when it registers a particular value on its scale. The same thermometer is then placed in another mug of coffee and it comes to thermal equilibrium at exactly the same value. Can you deduce from this whether or not the cups of coffee are in thermal equilibrium with each other?
Answer T1
Both mugs of coffee are in thermal equilibrium with the same thermometer. According to the zeroth law of thermodynamics the mugs of coffee must be in thermal equilibrium with each other. To put it another way, if the mugs were brought into close thermal contact, there would be no transfer of heat from one to the other. (Of course we are assuming that they have not had time to cool down between these various operations.)
2.3 Thermometers and thermometric properties
Subsection 2.2 should have given you a clear idea of what temperature means qualitatively but this still isn’t enough. We need to measure temperatures quantitatively; that is we need to define a numerical scale for the measurement of temperature. We can do this by defining temperature values in terms of the readings taken from a thermometer – provided that the instructions on how to construct and operate the thermometer are also specified. This procedure will provide what is called an operational definition of temperature.
As a first step towards setting up an operational definition of temperature we need to select some sort of physical property that can be used as a temperature indicator. You can probably think of several such properties. For instance, most solids and liquids expand when heated, so the degree of expansion might be used to measure temperature; or if a gas is heated while its volume is held fixed, its pressure increases, so that too might be a suitable property. i In fact, nearly all the properties of matter exhibit some reproducible variation with temperature, though the extent of the variation differs from case to case. A property that is used as an indicator of temperature in a thermometer is known as a thermometric property.
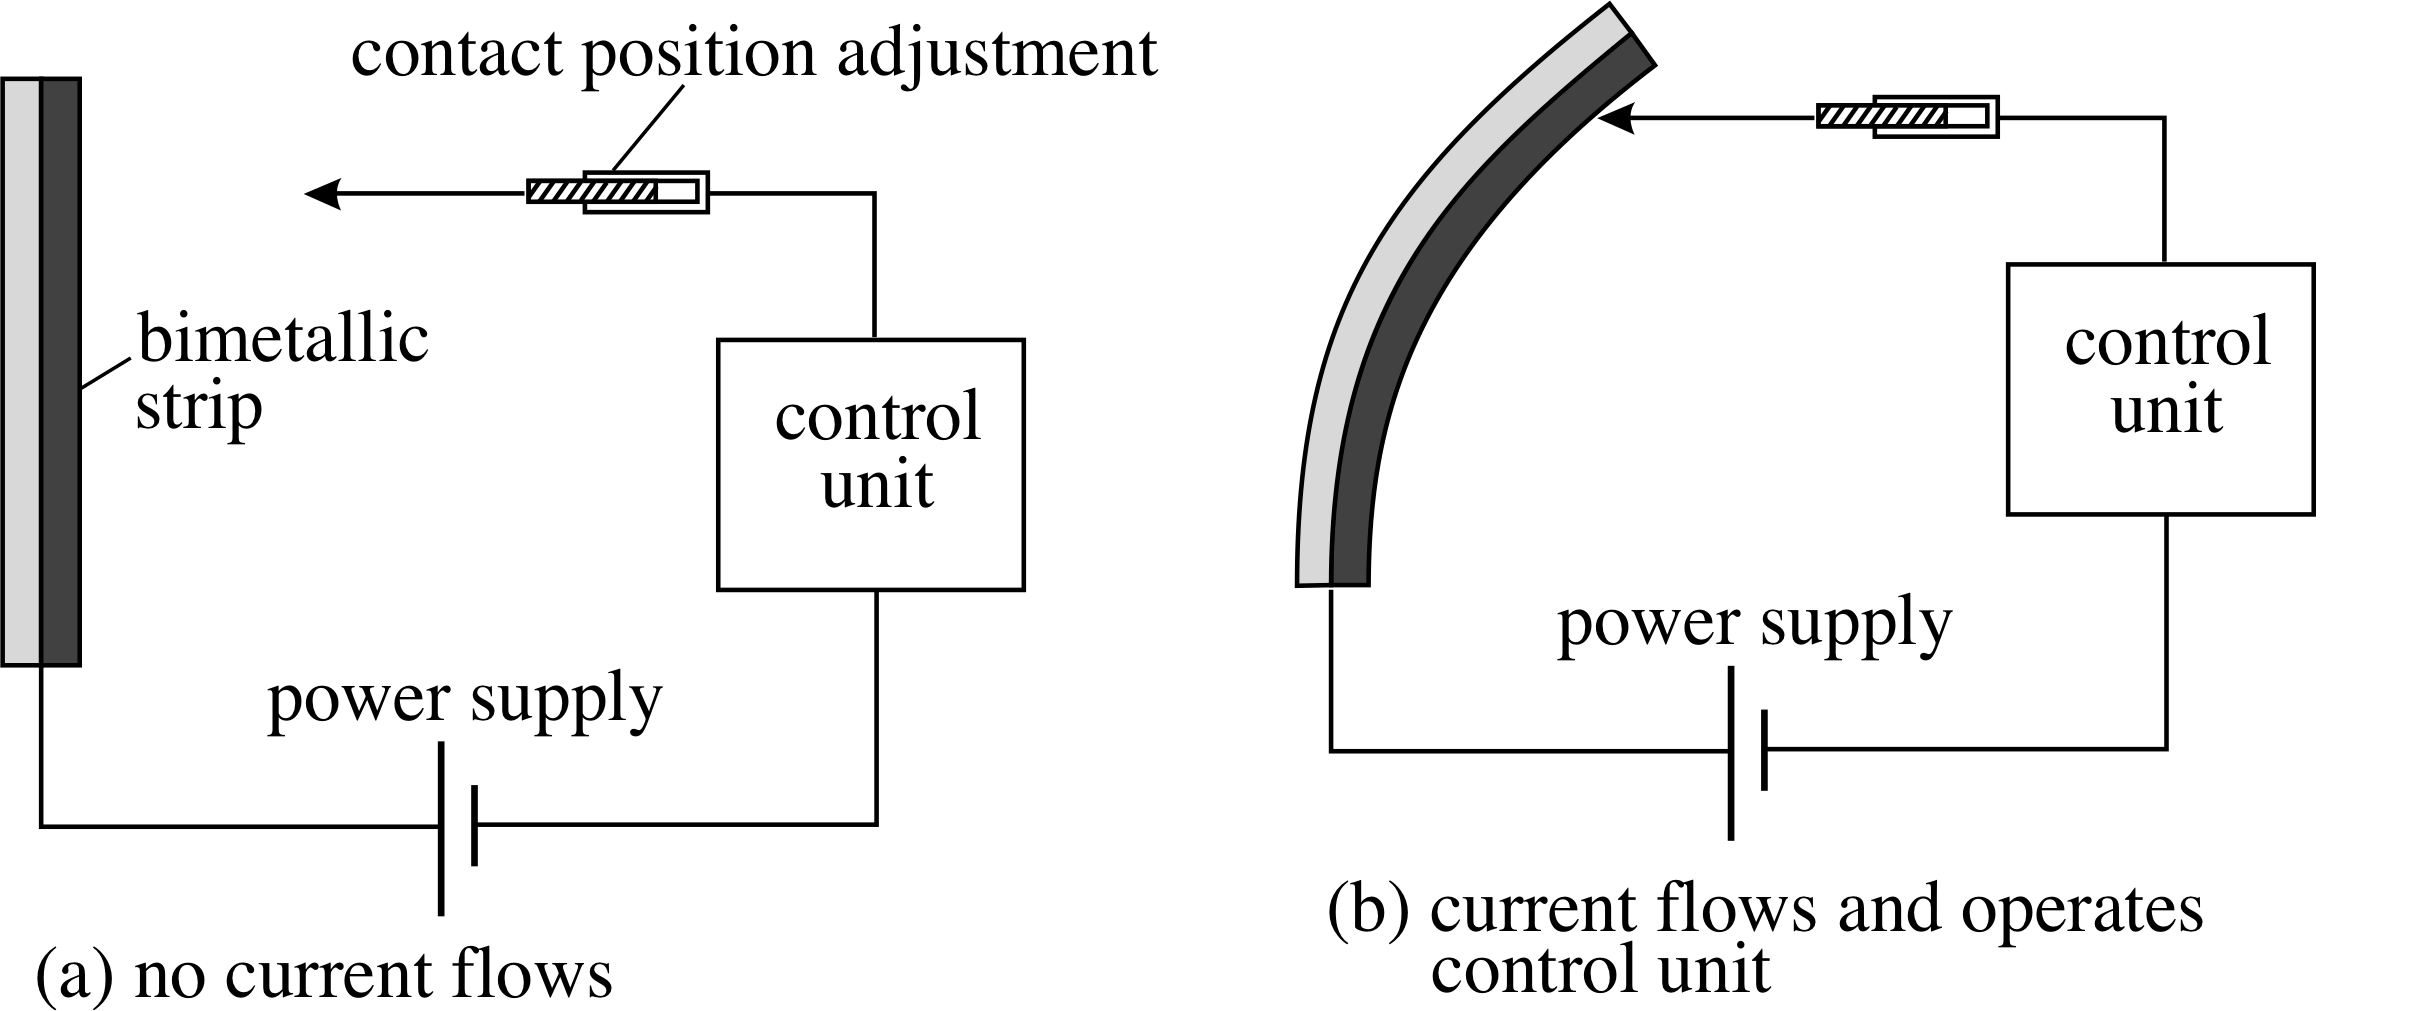
Figure 1 A bimetallic strip is made up of two different metals bonded together. Since the two metals expand by different amounts as the temperature is increased, the strip bends.
The expansion of solids is used in the bimetallic strip thermometer which is made by bonding together two dissimilar metals that expand by different amounts for a given temperature change. As the temperature rises the different expansions cause the strip to bend, and the degree of bending can be used to measure the temperature change. Such devices are used in oven thermometers, and can be incorporated into an electrical circuit to form a thermostat. i
In the case of the thermostat shown in Figure 1 the bimetallic strip bends more and more as the temperature rises, until eventually it closes the electrical circuit. The position of the electrical contacts can be adjusted to select the temperature at which the circuit closes.

Figure 2 A mercury-in-glass thermometer. The temperature scale can be extended above 100° centigrade and below 0° centigrade by assuming that the ‘size’ of the 1° centigrade interval is the same in these regions as it was in the region between the two calibration points. (See Subsection 2.4.)
The mercury_in_glass_thermometermercury–in–glass thermometer (illustrated in Figure 2) and alcohol_in_glass_thermometeralcohol–in–glass thermometer are very familiar. Here, it is the expansion of a liquid that is the thermometric property. The expansion is essentially confined to a narrow glass tube of uniform cross section, so the degree of expansion can be read from a linear scale. i
The constant_volume_gas_thermometerconstant–volume gas thermometer is a very sensitive laboratory instrument that measures temperature changes by detecting the variations in pressure that occur in a fixed volume of gas. We will return to a further consideration of this type of thermometer later because, although it is not very convenient for many purposes, it has fundamental importance in defining precise scales for the measurement of temperature.
Other thermometers are based on the change of electrical resistance of a metal or a semiconductor, as in a resistance thermometerresistance thermometer, or the electrical voltages generated at the junction of two dissimilar metals, as in a thermocouple. i
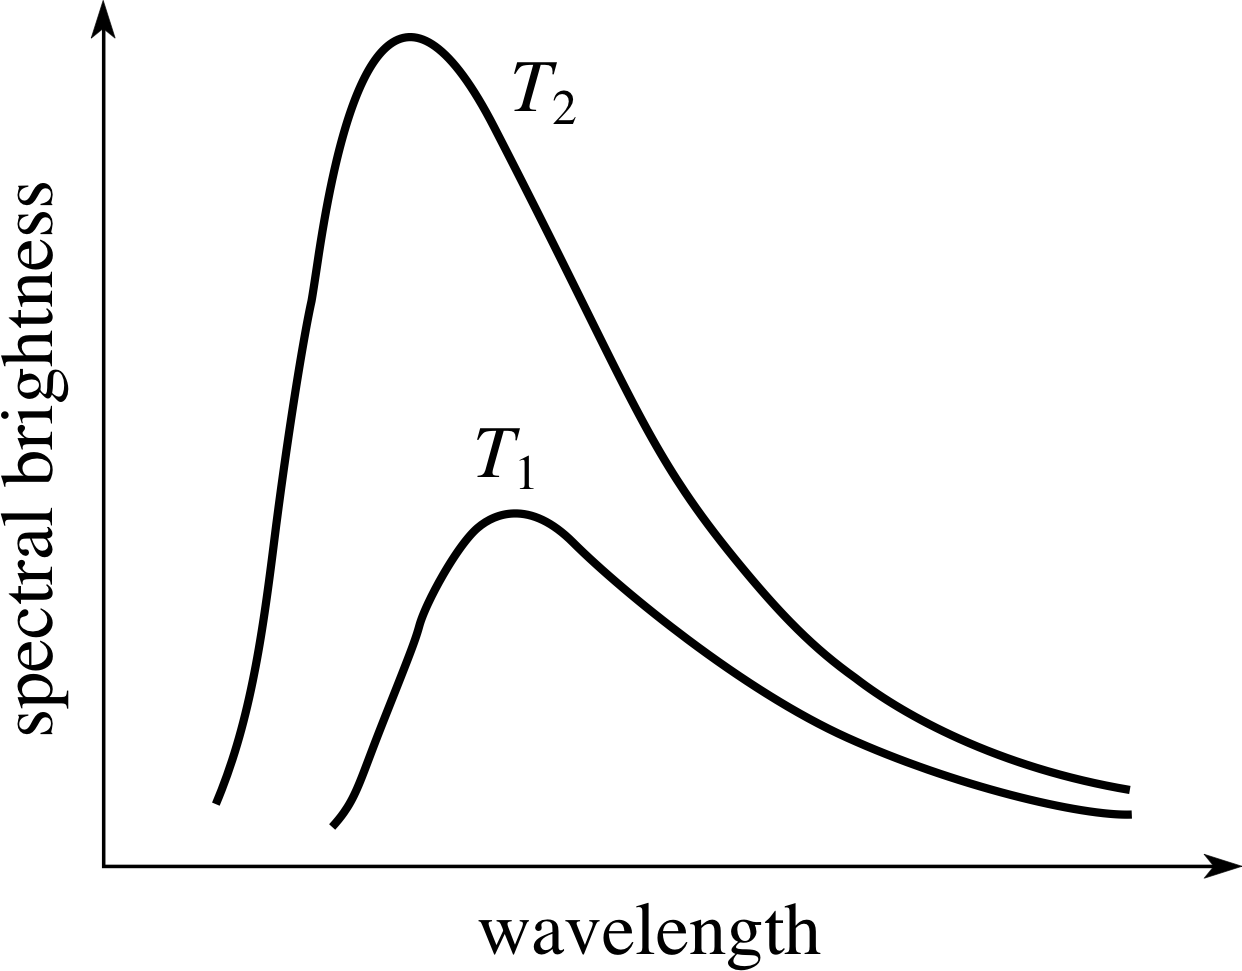
Figure 3 Spectra showing the variation with wavelength of the spectral brightness of hot bodies at two temperatures (T2 > T1). (Spectral brightness is the energy emitted per unit area per unit time per unit wavelength interval.) These curves are for the ideal emitters of radiation which are known as black bodies. Many real bodies have spectra broadly similar to the black–body spectrum.
Alternatively we can use the fact that hot bodies emit electromagnetic radiation in a manner that is characteristic of their temperature. In particular, as Figure 3 shows, the way in which the energy radiated by a hot body is distributed with respect to wavelength (i.e. its spectrum) changes with the temperature of the body. As the temperature increases, relatively more energy is emitted at shorter wavelengths.
If the temperature of the body is sufficiently high that it glows, emitting a significant amount of energy at visible wavelengths, then it will be found that increasing the temperature of the body changes its colour. At relatively low temperatures most of the emitted light will have the relatively long wavelength of red light and the object will appear ‘red-hot’. At higher temperatures a greater proportion of the energy will be emitted at shorter wavelengths and the object will appear yellow, white or even blue, depending on the precise mix of wavelengths.
A measurement of temperature based on the spectrum of emitted radiation can be made using a device known as a pyrometer. Pyrometers are used, for example, to measure the temperature of furnaces, though somewhat similar devices can be used for measuring the (high) temperature of the surface of the Sun or the (low) temperature of the background radiation in the universe.
Question T2
Without referring to the text, list the examples of thermometric properties given so far and try to list some other properties that might be used as thermometric properties.
Answer T2
So far we have mentioned thermal expansion (bimetallic strip, mercury-in-glass, alcohol-in-glass), pressure changes in a gas (constant-volume gas pressure), radiation (optical pyrometer), electrical resistance and thermocouple voltage. This question is open–ended and the commonest varieties have been mentioned. For new ones, how about tension in a constant–length elastic band? Constant-pressure gas volume? Time for a ball bearing to fall to the bottom of a golden–syrup tin?
2.4 Thermometers and temperature scales
Before we can use any of the thermometers described in the previous subsection to make a measurement of a temperature in a practical situation, we must first define a temperature scale. Early temperature scales such as the original Fahrenheit scale were rather arbitrary, but modern practice is to make international agreements on definitions, choices of thermometric properties, and detailed procedures. Without this standardization, measurements of the same temperature in different laboratories might seem to be different simply because they used different temperature scales and much time could be wasted in sorting them out. The international body which supervises agreements about temperature scales is the General Conference on Weights and Measures and, from time to time (roughly every ten or fifteen years), an improved set of recommendations is published; the most recent, at the time of writing, is called IPTS–90, an abbreviation for International Practical Temperature Scale, 1990. We will return to this in Subsection 4.5.
The definition of a particular temperature scale always involves the use of one or more easily reproduced fixed points or calibration points. These occur at particular temperatures and are identified with clearly defined events such as the melting of ice or the boiling of water under specified conditions. In order to define a particular temperature scale, numerical values must be assigned to the calibration points and some method prescribed for assigning values to those temperatures that are not calibration points. A familiar example of this might be the specification of a centigrade scale for a mercury-in-glass thermometer.
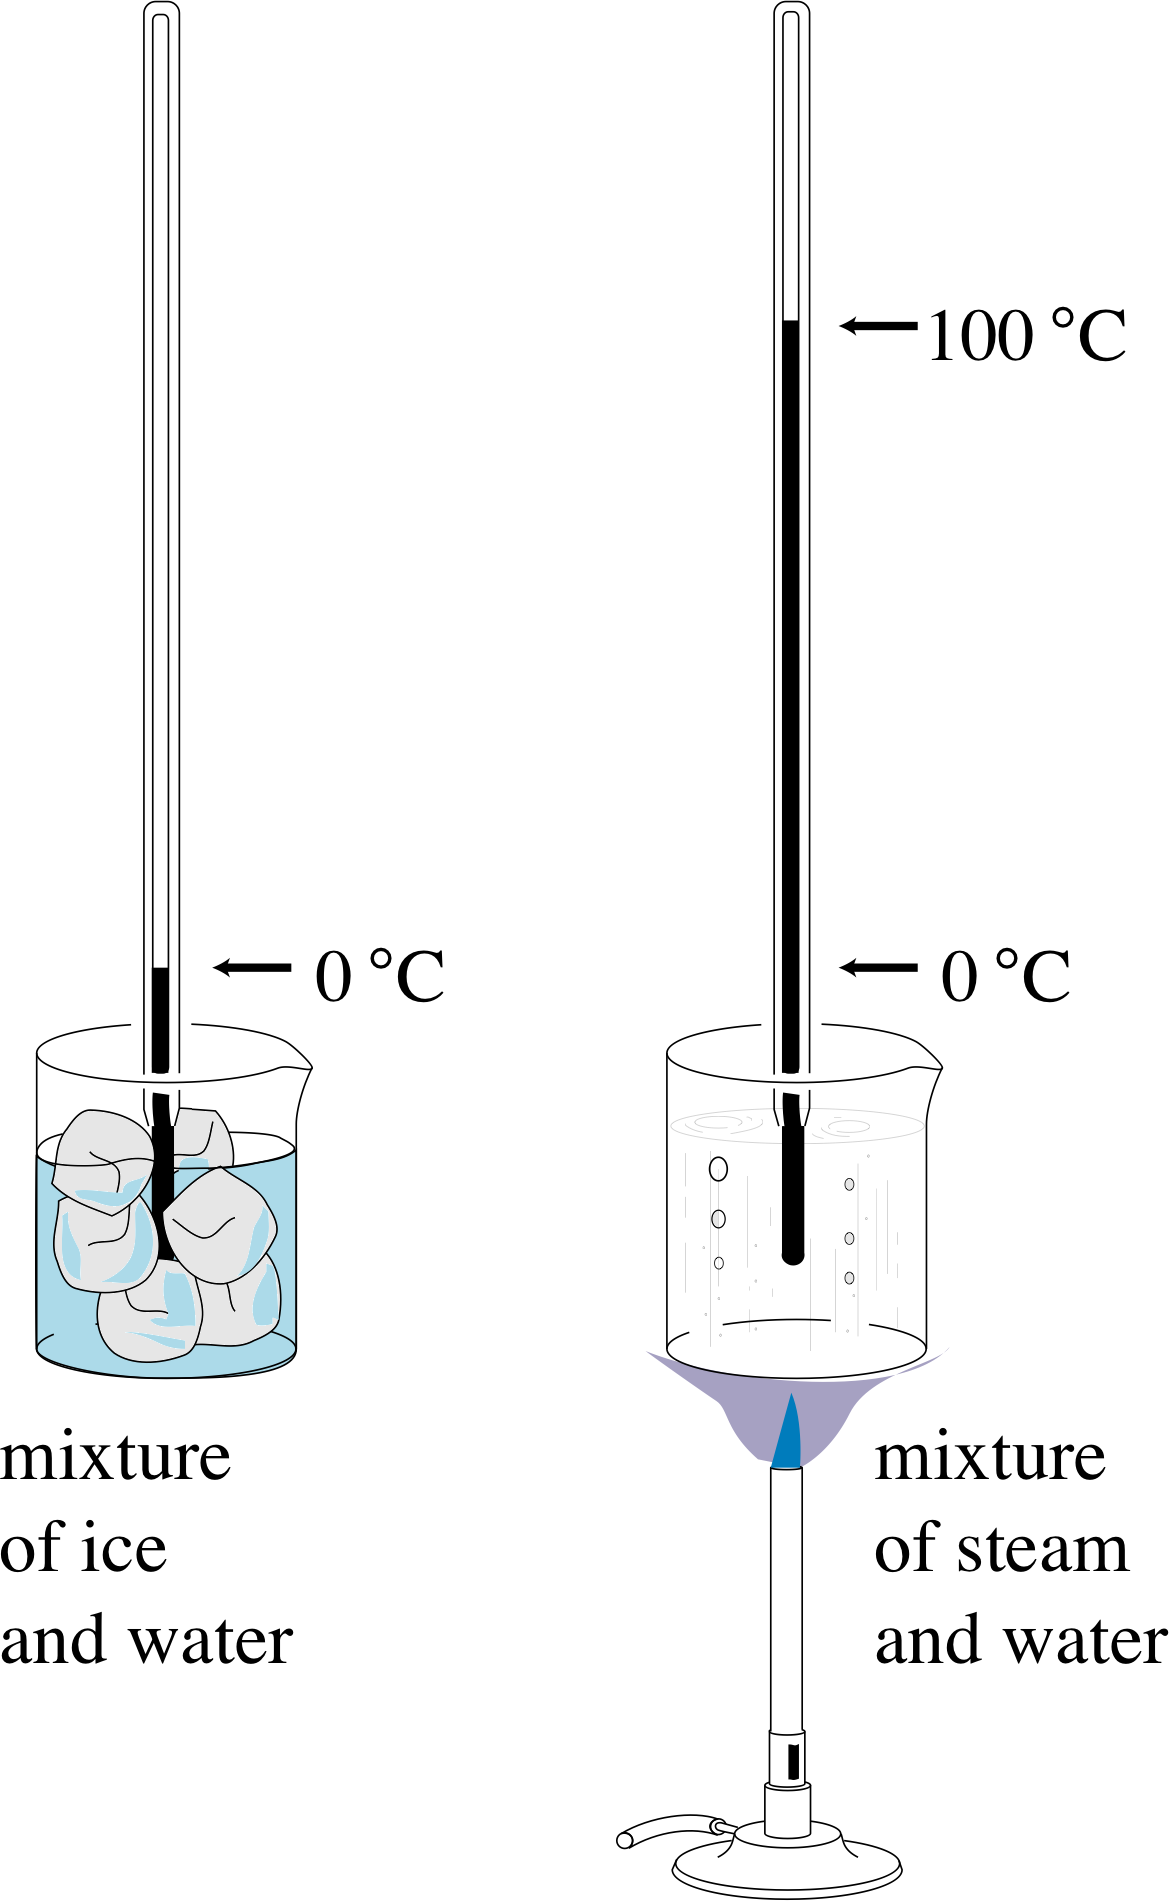
Figure 4 Calibrating a mercury-in-glass thermometer on a centigrade scale. The word ‘centigrade’ means that the range between the two calibration points is divided into one hundred equal parts.
The procedure in this case might be as described below (see Figure 4):
- 1
-
Allow the thermometer to come into thermal equilibrium with a mixture of water and melting ice under standard atmospheric pressure, i and then associate a temperature of 0° centigrade with the length l0 of the mercury thread.
- 2
-
Allow the thermometer to come into thermal equilibrium with boiling water under standard atmospheric pressure and associate a temperature of 100° centigrade with the length l100 of the mercury thread.
- 3
-
Having fixed the calibration points, divide the temperature range between them into 100 equal parts (degrees) by associating a mercury thread of length l with a temperature T, such that
$T = (l-l_0)\times\dfrac{100°\,{\rm centigrade}}{l_{100}-l_0}$(1)
An equation of this kind, relating the chosen thermometric property to the temperature, is called a thermometric relation. Note that the particular relation we have chosen implies that the temperature is linearly related to the length of the mercury thread, so the temperature change ∆T will be proportional to the change in length ∆l, i i.e.
∆T = constant × ∆l
Consequently, as long as the mercury does not freeze or boil, we can use the relationship between length and temperature to extend the scale beyond the range 0° and 100° (as in Figure 2).
✦ If l0 = 40 mm and l100 = 300 mm, what is the change in thread length that corresponds to a temperature change of 1° centigrade? What temperature corresponds to a thread of length 144 mm?
✧ For ∆T = 1 °centigrade the corresponding change in length is:
∆l = (l100 − l0)/100 = 2.60 mm
According to Equation 1,
$T = (l-l_0)\times\dfrac{100\,°{\rm centigrade}}{l_{100}-l_0}$(Eqn 1)
the temperature corresponding to 144 mm is given by:
T = [(144 − 40)/(300 − 40)] × 100 °centigrade = 40 °centigrade
You might wonder if the linear relationship between temperature and the length of the mercury thread is really correct. Is it true that the change of length is proportional to the change of temperature? However, such a question is really beside the point since the procedure outlined above is one that defines the numerical value of temperature – at least for the mercury-in-glass centigrade scale. More legitimately, you might ask whether the temperatures defined by this procedure will agree with those defined by some other procedure. Will centigrade temperatures based on a mercury-in-glass thermometer, for example, agree with centigrade temperatures obtained by applying the same three–step procedure to an alcohol-in-glass thermometer? Of course, the two kinds of thermometer must agree at the calibration points, by definition, but will they agree at every other temperature? The answer is that generally they will not. The thermometric properties used by different types of thermometers may well respond differently to changes in temperature, so different types of thermometer should not be expected to agree except at their mutual calibration points. Clearly, when making detailed measurements of temperature it is necessary to define the temperature scale very precisely so that there can be no ambiguity about what the measured values signify.
In 1954 it was agreed that neither the freezing point nor the boiling point of water were sufficiently reproducible to be used for the purpose of defining a highly precise temperature scale, and a different procedure was proposed which has lead to the definition of the current Celsius scale. i We will deal with the definition of this scale and other ‘scientific’ scales in Section 4, but is worth observing here that since 1954 Celsius is no longer defined as an exact centigrade scale. Celsius is not simply a fancy name for centigrade, although for many purposes, especially near room temperature or body temperature, the two scales are not noticeably different.
In spite of the decisions made in 1954, scales based on what might be called the centigrade principle continue to be widely used today, for the good reasons that (i) they are easily calibrated without sophisticated equipment and (ii) the highest precision is not usually necessary for everyday purposes. It is an unfortunate accident of history that the words ‘centigrade’ (meaning a hundred degrees) and ‘celsius’ both begin with the letter C. In this module we will try to preserve a distinction by using ° centigrade to denote degrees centigrade and °C to denote degrees celsius. Other authors often use °C for both scales indiscriminately and thereby obscure the special position of the strict Celsius scale.
2.5 A first look at gas thermometry
The fact that substances can change from solid to liquid and from liquid to gas at their melting and boiling points causes practical difficulties when designing a thermometer. For instance, the column of mercury in a glass tube, ceases to be useful below −38.8 °C (the temperature at which the mercury freezes), and above 356.7 °C (the temperature at which the mercury boils). So, although satisfactory for everyday applications, the mercury-in-glass thermometer is not suitable for wide–ranging scientific work. Something more versatile is called for.
In 1702, Guillaume Amontons (1663–1705) invented the gas thermometer. But since the instrument was not particularly convenient to use, its virtues were not immediately appreciated. Today, we realize that this type of thermometer is capable of overcoming many of the drawbacks of other thermometers, and it is now used to define the basic SI unit of temperature. In addition, it was the gas thermometer that led to the realization of the existence of an absolute zero of temperature, a lower limit to the temperature that matter can attain. Consequently, one of the main points of discussion in Section 4 will be the gas thermometer, but first we need to investigate the properties of gases, and that is the subject of Section 3.
2.6 Summary of Section 2
This section has been concerned with the concept of temperature and its measurement, on scales of our choice. If two objects are in thermal contact and there is no flow of heat between them, they are said to be in thermal equilibrium with each other and are at the same temperature. If two objects in contact are not in thermal equilibrium, then the one from which heat is flowing is said to have a higher temperature than the one to which heat is flowing, which is said to have a lower temperature.
The zeroth law of thermodynamics asserts that if each of two bodies is separately in thermal equilibrium with a third body, then the two bodies will also be in thermal equilibrium with each other. The process of measuring a temperature involves putting two bodies into thermal contact and allowing them to reach thermal equilibrium with each other, one being the body we are interested in and the other being a thermometer.
A thermometer is a device that uses some thermometric property that changes reproducibly with temperature to provide a numerical value of the temperature on some particular temperature scale. The thermometric property might, for example, be volume, electrical resistance or gas pressure. The definition of the temperature scale involves noting the values of the observed property at certain fixed points (e.g. the freezing and boiling points of water under standard atmospheric pressure) and using some thermometric relation to associate a unique temperature with each value of the observed property.
Question T3
Imagine you place an ordinary mercury-in-glass thermometer under your tongue in order to estimate your body temperature. After 10 s the thermometer reads 26.0°centigrade, after 20 s 32.0°centigrade, after 30 s 36.5° centigrade, after 40 s 37.0° centigrade after 50 s 37.0° centigrade, and after 1 min 37.0°centigrade. What comment could you make about thermal equilibrium (a) during the first 30 s of this measurement, and (b) during the last 20 s. Would you expect to register exactly the same temperature if the measurement were repeated with an alcohol-in-glass thermometer?
Answer T3
(a) During the first 30 s, the thermometer temperature is changing, implying that heat is being transferred from you to the thermometer. Therefore, you and the thermometer are not in thermal equilibrium with each other.
(b) In the last 20 s there is no change in the thermometer so we can assume the net transfer of heat is zero and therefore thermometer and mouth are in thermal equilibrium with each other. The alcohol-in-glass thermometer would only be certain to give exactly the same temperature at 0 °centigrade and 100 °centigrade the two fixed calibration points. At 37 °centigrade there could well be a discrepancy. (This could typically be several tenths of a degree.)
Question T4
The mercury thread in a mercury-in-glass thermometer reaches a length of 50 mm when it is placed in a mixture of melting ice and water and a length of 300 mm when placed in boiling water. Both experiments are conducted at a pressure of 1 standard atmosphere. The thermometer is then used to measure the temperature of a mixture of salt and ice. In this mixture, the mercury column reaches equilibrium at 10 mm. Estimate the salt–ice temperature and state the main assumption you are making.
Answer T4
For this thermometer a 100 °centigrade interval corresponds to 250 mm of mercury thread. Thus 1 centigrade degree corresponds to a thread length of 2.5 mm. The length of the thread in the ice–salt mixture is 40 mm less than the 0 °centigrade mark; 40 mm is equivalent to a temperature change of (40/2.5) °centigrade = 16 °centigrade, so the temperature of the mixture is −16 °centigrade. The assumption is that the change in length per centigrade degree change is independent of the temperature.
(You might like to reflect on the extent to which this really is an ‘assumption’.)
3 The behaviour of gases
3.1 Gas pressure
The properties of a gas are markedly different from those of a solid or a liquid. For instance, the volume of a given solid or liquid is a quantity that can be measured and that remains essentially fixed provided the temperature doesn’t change. But what is the volume of a gas? The answer, of course, is that the volume of the gas is the same as the volume of its container – change the volume of the container and the volume of the gas changes too. The gas expands to fill the space available. If we confine a quantity of gas in a cubical vessel then, ignoring the effects of gravity, the gas will exert outward forces of equal magnitude on each of the vessel’s walls. This is explained by saying that the gas exerts a pressure on each of the surfaces with which it is in contact. To be precise, the pressure on any one of the surfaces is given by the strength of the force perpendicular to that surface, divided by the area of that surface. In other words, the pressure is a measure of the magnitude of the perpendicular force per unit area, and can be calculated from the equation:
$P = \dfrac{\text{magnitude of the force perpendicular to the surface}}{\text{area of the surface}}$(2)
In SI units, P will be given in newtons per square metre or, equivalently, in pascal (Pa), where 1 Pa = 1 N m−2. i
Although we have arrived at this definition by considering a cubical vessel, the definition itself applies to surfaces of any shape, and by considering surfaces of very small size around any point of interest we may even use it to define the pressure at a point.
The pressure due to the gas is not only exerted on the container; it also exists throughout the gas itself, and on any surface within the gas. If the gas is in thermal and mechanical equilibrium i and if we neglect gravity, the pressure has the same value everywhere. The pressure is also independent of direction, which is to say that a surface of given area placed anywhere within the gas would experience the same strength force due to gas pressure, no matter which way it faced. This shows that pressure is a scalar quantity and allows us to relate it to the magnitude of the perpendicular force per unit area on a surface.
Let us consider this point further. From a microscopic point of view, it is easy to see why pressure in an equilibrium gas is independent of direction. Gas pressure at a surface is due to the bombardment of the surface by the molecules or atoms of the gas. As there is no preferred direction for the molecular motion in an equilibrium gas, there is no reason why the strength of the bombardment should depend on the orientation of the surface.
We can also argue the case macroscopically by carrying out a thought experiment. In a thought experiment we do not concern ourselves with practical details, provided we are satisfied that the experiment will work ‘in principle’. In that spirit we will initially ‘switch off’ gravity (imagine the experiment being performed in outer space far away from any massive bodies). Once we appreciate what is happening without gravity, we can switch gravity back on and see what effect it has.

Figure 5a A container of gas. The representative ‘prism’ used in the ‘gravity off’ scenario is shown.
Consider the container of gas shown in Figure 5a. Let us assume it is in thermal_equilibriumthermal and mechanical equilibrium, this means that the temperature is the same throughout the gas, and there is no bulk movement of the gas (although, of course, individual molecules or atoms are moving around within the gas). Now let us single out a small prism–shaped volume of the gas as shown in Figure 5a and draw imaginary boundaries around the sides. The figure shows the forces on the faces of the prism due to the pressure of the gas in the vessel. In equilibrium this prism of gas will be stationary like the rest, and newtons_laws_of_motionNewton’s laws tell us that the net force in any direction will be zero.
Consider the y–direction shown in Figure 5a.
✦ Write down the forces in the y–direction due to the pressure of the gas.
✧ There is a force of magnitude F2 acting upwards, and a force of magnitude F1 cos θ acting downwards.
If we take the upward direction to be positive, we can write the condition for mechanical equilibrium in the y–direction as:
F2 − F1 cos θ = 0
But from our definition of pressure and the dimensions in the figure we know:
F1 = P1cd and F2 = P2ad i
where P1is the pressure associated with F1, and P2 is the pressure associated with F2. Moreover, from the geometry of the situation cos θ = a/c. If we substitute for F1, F2 and cos θ in the equilibrium condition given above, we find:
$P_2ad = P_1cd\dfrac ac$
ThusP2 = P1
In a similar way we could show that P1 = P3. Notice that we didn’t say what angle θ was, so the result will be true for any θ. In other words the pressure is independent of direction, as expected.
When a gas is in equilibrium in the absence of gravity, the pressure within it is independent of direction and is the same everywhere.

Figure 5b A container of gas. The representative ‘disc’ of gas used in the ‘gravity on’ discussion.
Now let us repeat the experiment with gravity switched on. This time, to make life easier, we will single out a disc–shaped volume of gas (Figure 5b) of cross–sectional area A and thickness δh. i We follow the same line of reasoning as before but this time when we add up the forces acting in the vertical direction, we have to take into account the weight of the ‘disc’ of gas; this acts downward and is of magnitude mg where m is the mass of the gas within the disc and g is the magnitude of the acceleration due to gravity. The condition for equilibrium now leads to:
F2 − F1 − mg = 0
i.e.P2A = P1A + mg = P1A + ρVg
where we have written m as ρV with ρ as the density of the gas and V the volume of the disc.
SinceV = Aδh, P2A = P1A + ρAδhg
thereforeP1 = P2 − ρgδh
This means that for a gas in equilibrium in the presence of gravity, because of the weight of the gas itself, the pressure in the gas decreases with height. As you might expect, this also means that the density will decrease with height, since the gas at the bottom will be compressed by the weight of gas above. Nonetheless, it remains true that at any given height the pressure is independent of direction.
When a gas is in equilibrium in the presence of gravity, the pressure within it is independent of direction and decreases with height.

Figure 5c A container of gas. A stack of such discs.
We could in principle imagine the gas in a container to be composed of a stack of discs of the kind we have just considered. Such a stack is shown in Figure 5c, where the discs have been numbered 1 to n. The difference in pressure between the bottom of the stack and the top, Pdiff would be:
Pdiff = ρ1gδh1 + ρ2gδh2 + ρ3gδh3 + ... + ρngδhn(3a) i
where ρi (with i = 1 to n) is the average gas density in disc i and δhi is the height of disc i.
Now, although we have been talking about gases up till now, exactly the same reasoning can be applied to pressure in a liquid. In fact, Equation 3a applies to all fluids (that is gases and liquids). However, to a good approximation, liquids are incompressible (i.e. the volume of the liquid is not affected by a change of pressure). So the density in a liquid in equilibrium under gravity will have the same value, ρ say, in each disc, and we can therefore write ρ1 = ρ2 = ... = ρn = ρ. i Under these circumstances Equation 3a simplifies to give:
Pdiff = ρg (δh1 + δh2 + δh3 + ... + δhn) = ρgH(3b) i
where H is the height of the liquid.
Question T5
The density of water is about 1.0 × 10³ kg m−3. How high must a column of water be if the pressure at its bottom is 1.0 × 10⁵ Pa greater than the pressure at its top. (You may assume g = 10 m s−2)
Answer T5
Since Pdiff = 1.0 × 10⁵ Pa in this case,
H = 1.0 × 10⁵ Pa/ρg
Hence,H = 1.0 × 10⁵ Pa/(1.0 × 102 kg m−3 × 10 m s−2) = 10 m
(Remember, 1 Pa = 1 N m−2 = 1 (kg m s−2) m−2).
Mathematical aside
If you are familiar with the process of integration you will recognize that the sum in Equation 3a,
Pdiff = ρ1gδh1 + ρ2gδh2 + ρ3gδh3 + ... + ρngδhn(Eqn 3a)
is of the kind that leads very naturally to an integral. If we let h denote the height above the bottom of the container, and if we indicate that the density of the fluid depends on h by writing it ρ (h) (read as ‘ρ of h’ or ‘ρ, a function of h’) then in the limit as δhi approaches 0:
$\displaystyle P_{\rm diff} = \int_0^H \rho(h)\,g\,dh$(3c) i
In the special case where the fluid is incompressible and ρ (h) is constant Equation 3c gives Pdiff = ρgH, in agreement with Equation 3b.
3.2 Barometers and atmospheric pressure
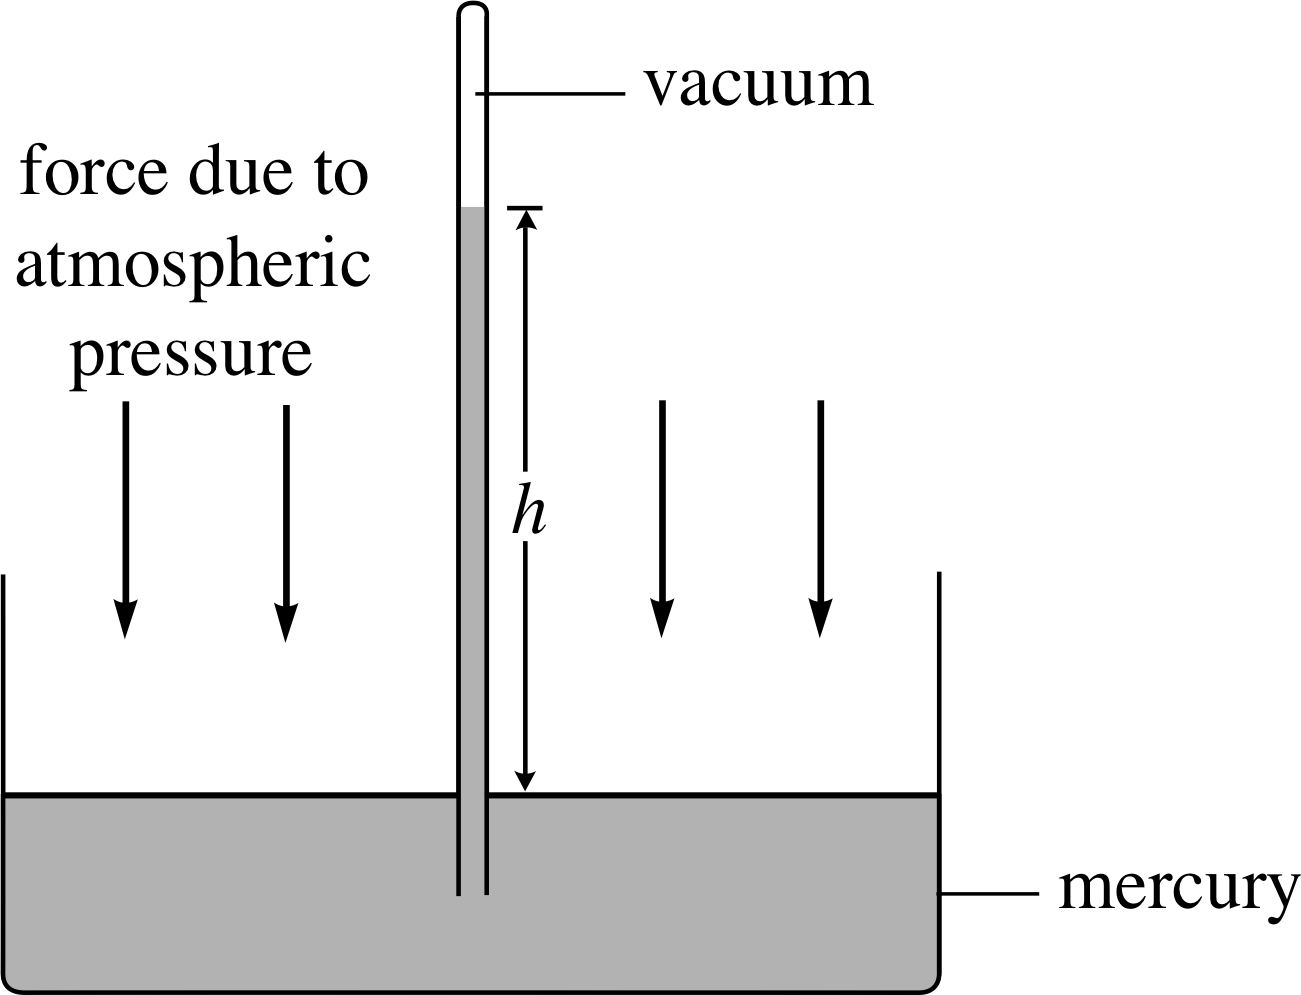
Figure 6 Atmospheric pressure forces mercury up inside a sealed glass tube until forces are balanced. If there is a vacuum above the mercury column, then atmospheric pressure is equal to ρgh.
The thickness of the Earth’s atmosphere is about 30 km, so the pressure it exerts at sea-level, usually called atmospheric pressure, is considerable. We tend not to be aware of it because the pressures inside and outside our bodies are usually in balance. A famous demonstration of air pressure was set up in the 17th century by a one–time mayor of Magdeburg, Otto von Guericke (1602–1686). He had developed a form of air pump, and with it he evacuated the air from a large sphere made from two bronze hemispheres pushed together. He then challenged the assembled crowd to pull the hemispheres apart; no one could and nor could two teams of eight horses! The explanation is that the pressure inside the sphere is very small and atmospheric pressure from outside pushes the hemispheres together; to separate the hemispheres requires a force equal to the atmospheric pressure multiplied by the cross–sectional area of the sphere.
The principles discussed in the previous subsection are used in the mercury barometer to measure the atmospheric pressure. Figure 6 shows the general idea. The air pressure exerted on the surface of the mercury in the dish is transmitted to the base of the column where it forces mercury to rise up the sealed, evacuated glass tube. The mercury column will cease to rise when the pressure it exerts h exactly balances the air pressure acting on the mercury in the dish.
From Equation 3b,
Pdiff = ρgH(Eqn 3b)
the pressure exerted by the column at the surface of the dish is then ρgh, where h is the height of the column.
Question T6
(a) Assuming that the pressure on the upper surface of the mercury column in Figure 6 is zero, calculate the height of the column when it just balances an atmospheric pressure of 1.02 × 10⁵ Pa. The density of mercury is 1.36 × 10⁴ kg m−3. (Take g = 9.80 m s−2).
(b) Why is it likely to be easier to construct a mercury barometer than one that used a column of water in place of the column of mercury?
Answer T6
(a) The pressure exerted by the mercury column is ρgh, so h = P/ρg
In this case:
$h = \rm \dfrac{1.02\times10^5\,N\,m^{-2}}{1.36\times10^4\,kg\,m^{-3}\times9.80\,m\,s^{-2}} = 0.765\,m = 765\,mm$
(b) Comparing this with the answer to Question T5, (10 m) you can see that a water barometer would have to be more than ten times taller than a mercury barometer in order to measure atmospheric pressure.
The answer to Question T6 should show you why mercury rather than water is preferred for barometers – even though it is expensive and toxic! Because of the common use of mercury barometers, air pressures are often quoted in millimetres of mercury or torr (1 torr = 1 mmHg). i
As you may know from watching the television weather forecasts, atmospheric pressure at the Earth’s surface fluctuates within a few per cent of its average value. Sometimes it is convenient to express pressure values as multiples of the average sea–level atmospheric pressure. Consequently, another unit of pressure, the standard atmosphere (atm), has been defined exactly as:
1 atm = 1.013 25 × 105 N m−2 = 1.013 251 × 105 Pa(4)
1 × 10⁵ Pa is also called one bar and is subdivided into 1000 millibars. Thus there are several commonly used units of pressure:
- the pascal (the SI unit of pressure 1 Pa = 1 N m−2)
- the torr (1 torr = 1 mmHg)
- the standard atmosphere (1 atm = 1.013 25 × 105 Pa)
- the bar (1 bar = 1 × 10⁵ Pa)
At petrol filling stations, air pressure is often given in units of pounds per square inch (psi) – yet another pressure unit! (1 psi = 0.068 05 atm). You should remember that such pressure gauges register pressure in excess of atmospheric pressure.
Question T7
The density of mercury at the freezing point of water is 1.3595 × 10⁴ kg m−3; the magnitude of the acceleration due to gravity is 9.806 65 m s−2. Work out how many (a) standard atmospheres, and (b) torr, there are in one pascal.
Answer T7
(a) Given that 1 atm = 1.013 25 × 105 N m−2 = 1.013 25 × 105 Pa, it follows that:
1 Pa = 1/(1.013 25 × 105) atm = 9.872 × 10⁻² atm
(b) Given that 1 torr = 1 mm Hg = 10−3 mHg, it follows from Equation 3b,
Pdiff = ρgH(Eqn 3b)
that
1 torr = ρgh = 1.3595 × 10⁴ kg m−2 × 9.80665 m s−2 × 10⁻³ m
1 torr = 133.3 kg m s−2 m−2 = 133.3 N m−2 = 133.3 Pa
i.e.1 Pa = (1/133.3) torr = 7.50 × 10⁻³ torr.
3.3 Boyle’s law
Since gases can take on a whole variety of different volumes and pressures, it’s not surprising that Robert Boyle (1627–1691) was ‘not without delight and satisfaction’ when he discovered, in 1661, that the pressure and the volume of a given quantity of air were related in a definite way, provided the temperature was not allowed to change. i Boyle discovered that whenever the given quantity of contained air occupied a volume V1, it exerted a unique pressure P1 on the walls of the container. When the volume was changed, the pressure changed in response. But when the volume was changed back to V1, the pressure also changed back to P1. In other words, at constant temperature each possible value of the volume V for a given quantity of air had associated with it one, and only one, value of pressure, P.
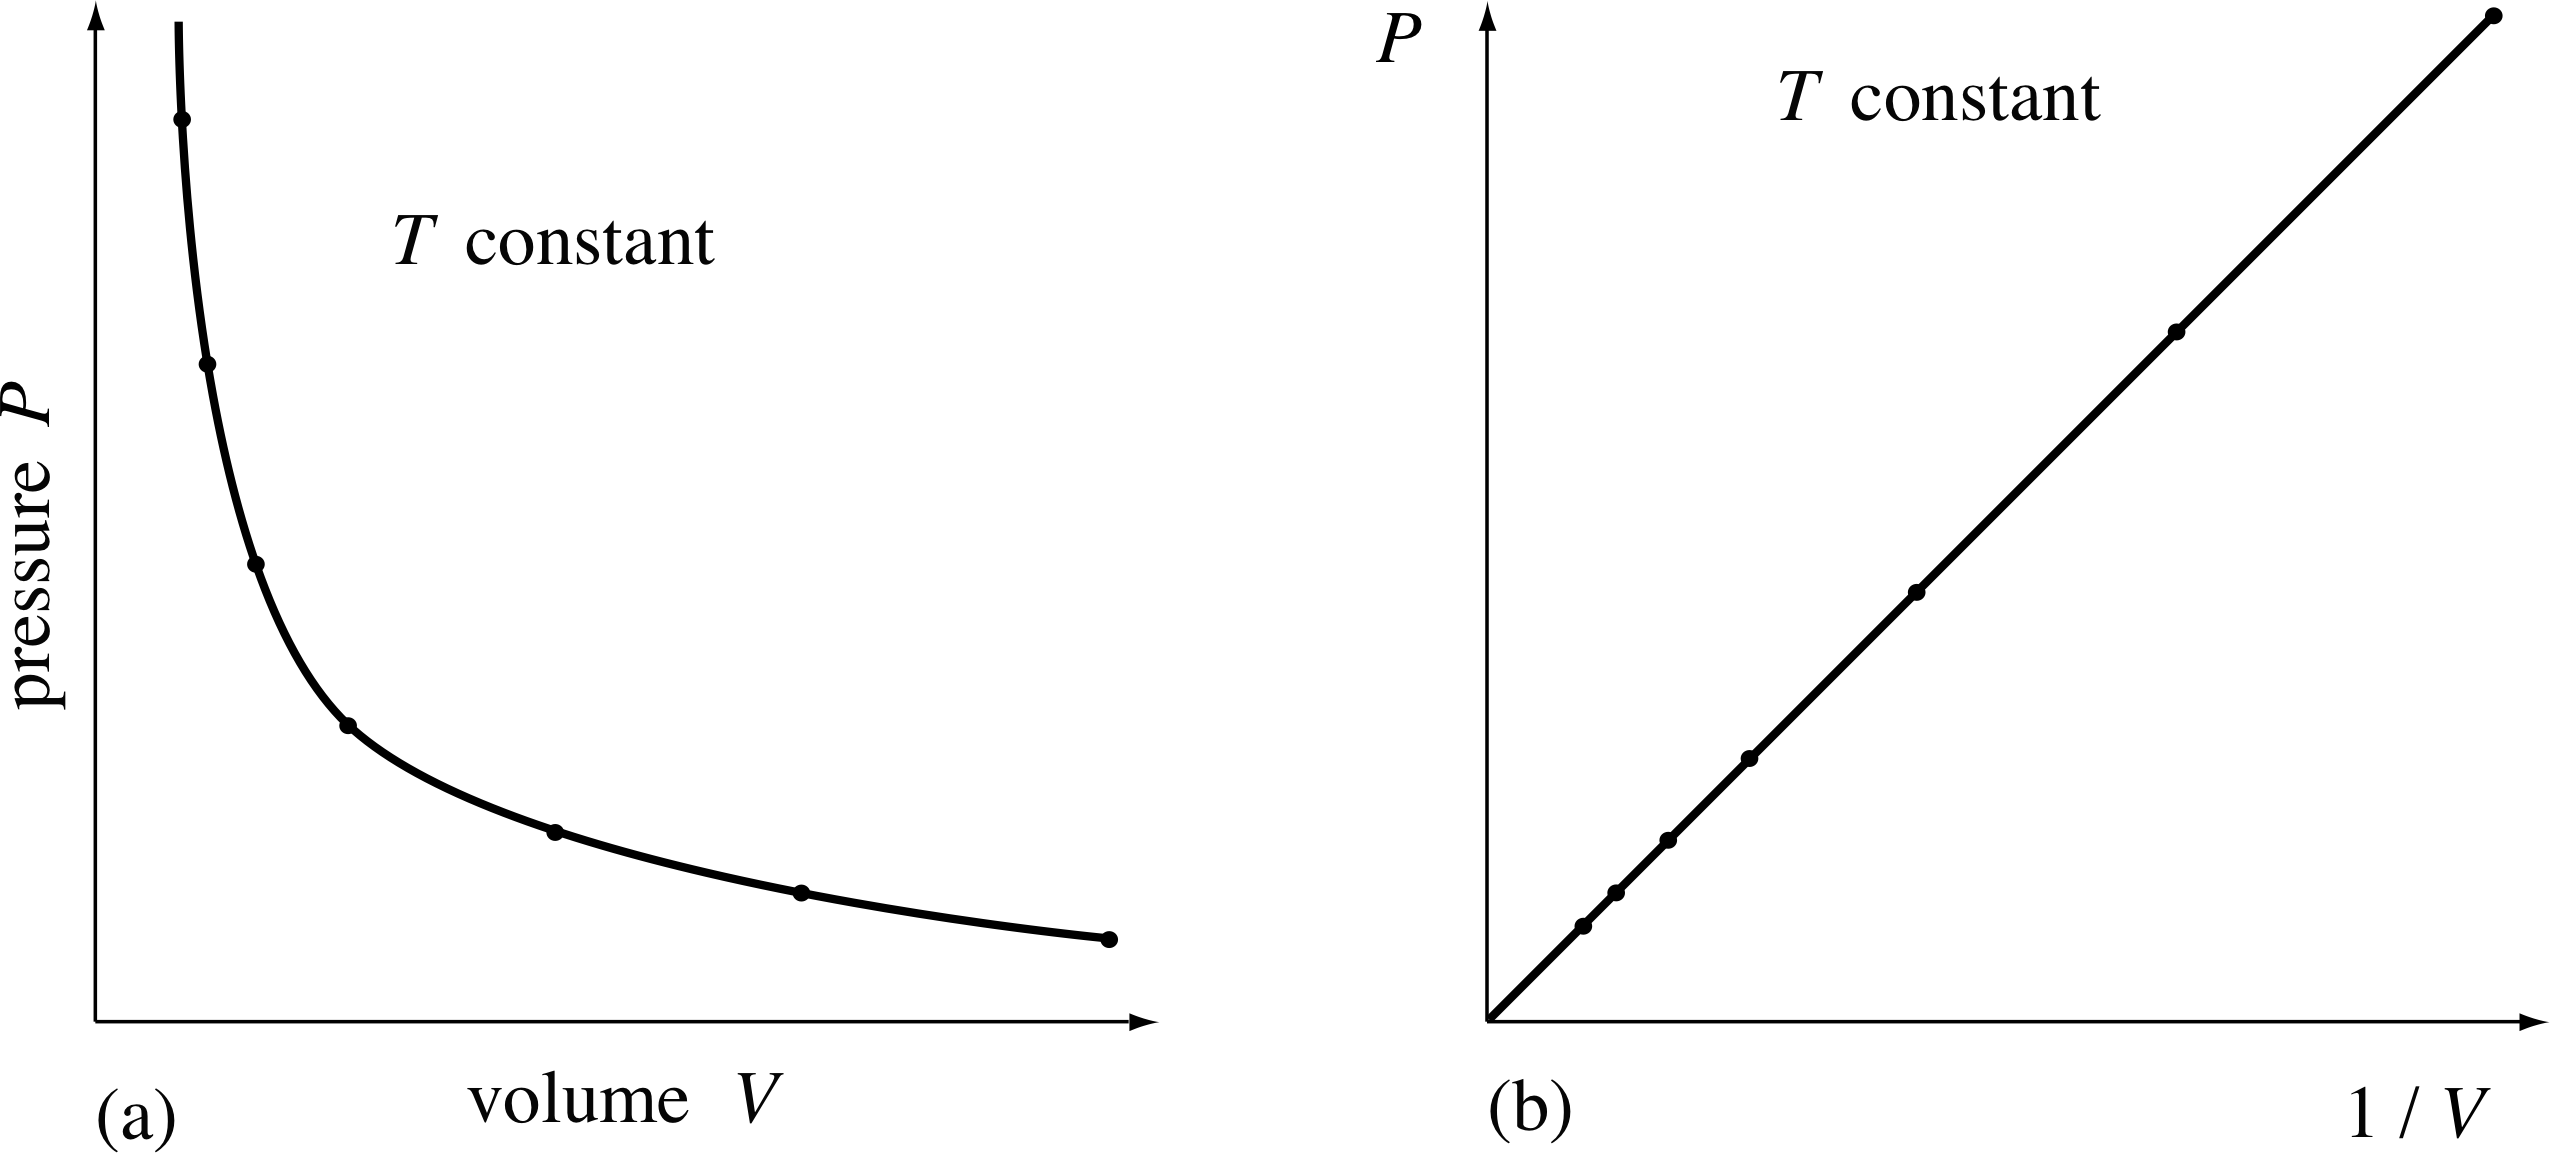
Figure 7 A given sample of gas at a constant temperature, occupying a given volume V, exerts a pressure P on the walls of the container. (a) For each value of V, the value of P is uniquely determined. (b) A plot of P against 1/V.
The particular relationship that Boyle found between P and V is shown in Figure 7a. Clearly, it is not linear, so P is not directly proportional to V (the shape is in fact a hyperbola. i
However, Boyle noticed that if P were plotted against 1/V, then a straight line would result (Figure 7b). As he wrote in his paper, ‘the pressures and volumes of air ... are in reciprocal proportions’. Hence the relationship between the pressure and volume of a fixed quantity of air at a fixed temperature is:
P ∝ 1/V
and from this he deduced:
Boyle’s law
PV = constant(5)
for a fixed mass of gas at a constant temperature.
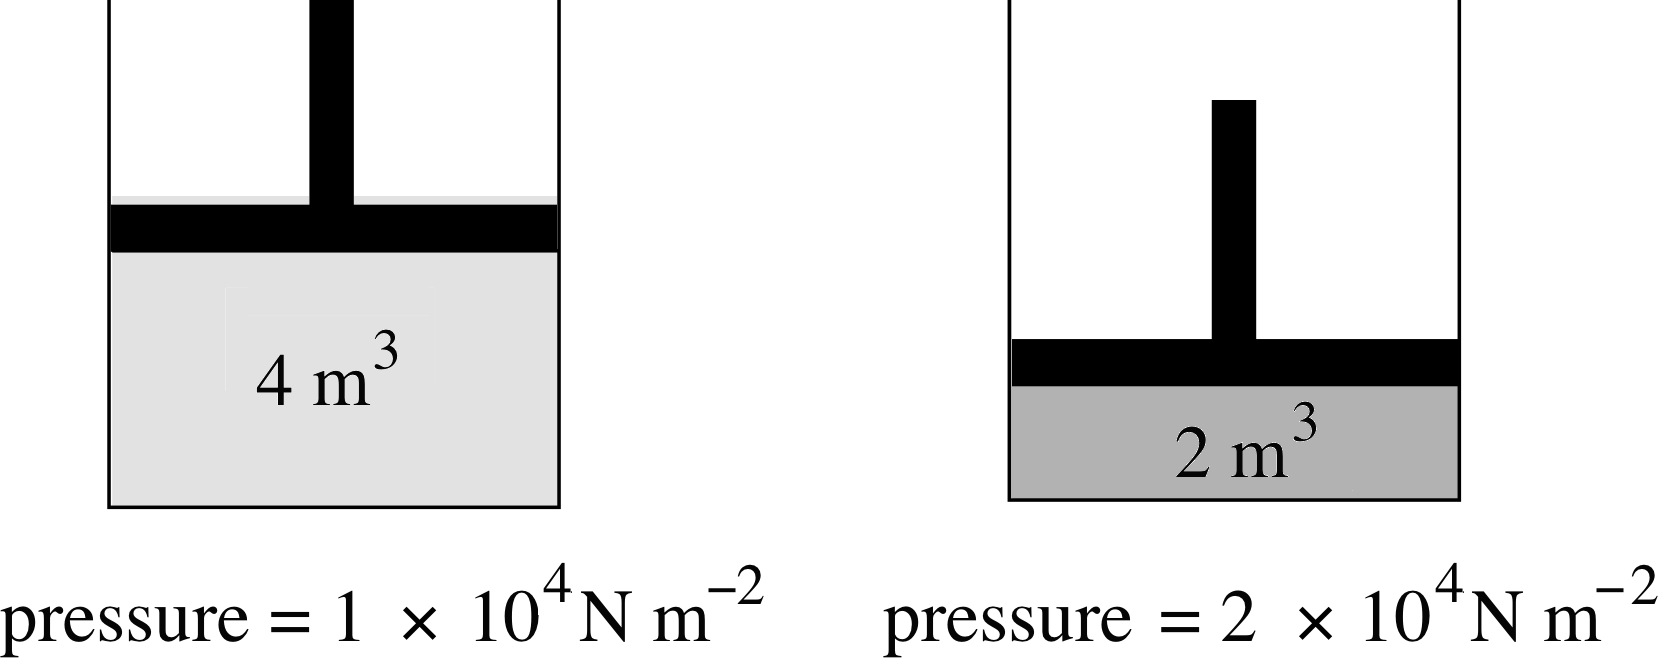
Figure 8 When the volume available to the gas is halved, the pressure exerted by the gas is doubled. (Note that the SI unit of pressure is the pascal, 1 Pa = 1 N m−2).
Figure 8 shows an example of this relationship. As the volume of the gas is halved, the pressure exerted by the gas doubles. Equation 5 holds true whatever the shape of the container and, to a good approximation, whatever the nature of the gas. Boyle himself tested the validity of this equation for air at pressures ranging from about (1/30) atm to about 4 atm. Notice that Boyle’s law does not specify what the temperature should be, only that it must remain constant throughout the experiment.
✦ How would you expect the graphs of Figure 7 to change if the experiment were carried out at a different temperature?

Figure 9b The relationship between pressure P and volume V for a fixed quantity of gas at different temperatures. For a fixed volume, the pressure increases with increasing temperature. Figure shows P plotted against 1/V.

Figure 9a The relationship between pressure P and volume V for a fixed quantity of gas at different temperatures. For a fixed volume, the pressure increases with increasing temperature. P is plotted against V.
✧ Your own experience probably tells you that increasing the temperature of a fixed quantity of gas at a given volume will increase its pressure.
Figure 9 confirms this.
These figures show that the form of the PV relationship is always the same, but if the temperature is higher the same volume of gas will exert a higher pressure.
Another way of saying this is that the constant in Equation 5,
PV = constant (Eqn 5)
increases with temperature.
Question T8
Air at a pressure of 3 atm i fills a car tyre with a total volume of 4.2 × 10⁻² m3. What volume would this air occupy if it were released at atmospheric pressure without a change in temperature?
Answer T8
Since PV = constant, according to Boyle’s law, it follows that P1V1 = P2V2, therefore
V2 = V1P1/P2 = (4.2 × 10−2 × 3.0/1.0) m3 = 0.13 m3 (to two significant figures).
Note that since the answer involves the ratio of two pressures, we have not converted them from atm into psi: the conversion factors would have cancelled.
Question T9
A bicycle tyre tube has a volume of 1.2 × 10⁻³ m3. The barrel of a bicycle pump has a working volume of 9.0 × 10⁻⁵ m3. How many strokes of this pump are needed to inflate the initially flat tube (i.e. containing no air) to a pressure of 3.0 × 10⁵ Pa, the atmospheric pressure being 1.0 × 10⁵ Pa?
You should assume that the temperature is constant throughout the pumping.
Answer T9
The final quantity of air in the tube was initially at a pressure of 1.0 × 10⁵ Pa. Since temperature is constant we may use Boyle’s law with P1V1 = P2V2 so initially the air must have occupied a volume:
$V_1 = \dfrac{P_2V_2}{P_1} = \rm \dfrac{3.0\times10^5\,Pa\times1.2\times10^{-3}\,m^3}{1.0\times10^5\,Pa} = 3.6\times10^{-3}$
The number of pump strokes is then determined from this volume divided by the volume of the pump barrel:
3.6 × 10⁻³ m3/(9.0 × 10−5 m3) = 40
3.4 Charles’ law
Boyle’s law describes the relationship between the pressure and volume of a gas at constant temperature. Charles’ law is concerned with how the volume changes at constant pressure. Jacques Charles (1746–1823) found that, for a given mass of almost any gas at any constant pressure the volume increases linearly with the temperature and is given by:
Charles’ law
$V = V_0\left(1+ \dfrac{T_{\rm cen}}{273\,°{\rm centigrade}}\right)$(6a) i
for a fixed mass of gas at a constant pressure.
where Tcen is the centigrade temperature and V0 is the volume of the gas at Tcen = 0° centigrade (the freezing point of water). Equation 6 contains a very important piece of information concerning the idea of temperature. To see what it is, consider the following question.
✦ What is the value of V for Tcen = −273° centigrade?
✧ Equation 6a,
$V = V_0\left(1+ \dfrac{T_{\rm cen}}{273\,°{\rm centigrade}}\right)$(Eqn 6a)
states that for Tcen = −273 °centigrade, V = 0!
Of course Charles had no way of verifying whether or not his law was still true at such low temperatures, but Equation 6a does suggest that there might be a lower limit of temperature, below which it is impossible to go.
In fact Charles’ law turns out to be surprisingly accurate. There is a lower limit of temperature, very close to −273° centigrade. For obvious reasons this is referred to as the absolute zero of temperature. More detailed study of thermodynamics suggests that this temperature can never be achieved in practice but it is possible to get very close to it. Nowadays, samples can be cooled to within a few millionths of one degree of absolute zero!
In Section 4 we will discuss the absolute temperature scale, in which temperatures are measured in SI units called kelvin (K) that are very similar to degrees centigrade, and absolute zero is assigned a value of 0 K. For the moment though we note that if we let T be the temperature on this absolute scale, measured from this absolute zero, then Charles’ law may be written in the simplified form:
Charles’ law (simplified form with T measured in kelvin)
$\dfrac VT = \text{constant}$(6b) i
for a fixed mass of gas at a constant pressure.
When we recall Charles’ law in later subsections this is the form in which it will be used.
Question T10
A weather balloon consists of a sealed bag, made of a very light, flexible, plastic film, containing helium gas. The balloon has a volume of 10 m3 at 20° centigrade. What would be its volume at the South Pole, at the same pressure but at a temperature of −40° centigrade?
Answer T10
You can use Equation 6a,
$V = V_0\left(1 + \dfrac{T_{\rm cen}}{273\,°{\rm centigrade}}\right)$(Eqn 6a)
At 20 °centigrade the volume is V20 = V0(1 + 20/273).
At −40 °centigrade V−40 = V0(1 − 40/273).
Dividing one equation by the other, we find:
$\dfrac{V_{-40}}{V_{20}} = \dfrac{V_0(1-40/273)}{V_0(1 + 20/273)}$
so$V_{-40} = V_{20}\dfrac{(1-40/273)}{(1 + 20/273)} = \rm 10\times\dfrac{0.85}{1.07}\,m^3 = 7.9\,m^3$ (to two significant figures)
3.5 The ideal gas law
There is a useful idealization of gas behaviour which can be formally defined as that in which Boyle’s law is exactly true for all temperatures and pressures. A gas which behaves in this way is called an ideal gas and although it is an idealization, real gases approach it under certain conditions. There are two reasons why it is useful to formulate the equations that an ideal gas would obey. First, these equations are simple and provide a valuable ‘first approximation’ to the equations that describe real gases. Second, the deviations from ideal gas behaviour that real gases exhibit can give us insight into the microscopic properties of real gases.
The pressure, volume and temperature of a fixed amount of any gas are always related. The equation that represents that relationship for a particular gas is called the equation of state of that gas. For an ideal gas the equation of state is particularly simple. It is the purpose of this subsection to introduce and explain that equation.
First of all, we need to be able to specify the ‘amount’ of gas. The mass seems to be the obvious way of doing this (and we return to this point towards the end of this subsection) but there are alternatives which are often preferred by physicists and chemists. For example, one might prefer to specify the number of atoms or molecules in the gas, and this is certainly the natural way of working when trying to understand the behaviour of gases in terms of atoms or molecules moving around inside a container. The problem with this is that for any practical volume of gas, the number of atoms or molecules involved is enormous.
To get around this we often use the mole (abbreviated to mol) as a unit of quantity.
One mole is a quantity which contains as many entities as there are carbon atoms in 0.012 kg of carbon-12. i
The entities referred to here depend on context; they may be atoms, molecules, ions, electrons, or even grains of sand – the mole is simply a quantity. However, for the purposes of this module we will always be talking about one or more moles of a gas with the understanding that the ‘entities’ will always be atoms or molecules.
The number of atoms in 0.012 kg of carbon-12 has been found, from the mass of a single carbon-12 atom, to be 6.022 045 × 1023. i This number, the number of entities in one mole, is called Avogadro’s number. i A related physical constant, measured in units of mol−1 is:
Avogadro’s constant NA = 6.022 045 × 1023 mol−1
Given a sample of gas containing N entities (atoms or molecules), the number of moles in the sample is
$n = \dfrac{N}{N_{\rm A}}$(7)
✦ If a sample of gas contains 1.000 × 1024 molecules, what is the corresponding value of n?
✧ The value of n is given by:
$n = \rm \dfrac{1.000\times10^{24}}{6.022\times10^{23}\,mol^{-1}} = 1.66\,mol$
Note that n is defined in such a way that it is measured in units of mole: it is not simply a number.
You may wonder why 6.022 045 × 1023 mol−1 was chosen for NA, rather than something straightforward – like 1.00 × 10²³ mol−1? Believe it or not it was chosen to make things simpler! With this value of NA the mass of one mole of any substance, expressed in grams, is numerically equal to its relative atomic mass or relative molecular mass. This is because one mole of any substance contains the same number of atoms (or molecules) as one mole of carbon-12, so the mass of one mole of any substance is given by:
$\dfrac{\text{mass of one mole of substance}}{\text{mass of one mole of carbon-12}} = \dfrac{\text{average mass of one atom (or molecule) of substance}}{\text{mass of a carbon-12 atom}}$
Since the mass of one mole of carbon-12 is 0.012 kg = 12 g, it follows that the mass of one mole of any substance, measured in grams, is
$\text{mass of one mole of substance/g} = \dfrac{\text{average mass of one atom (or molecule) of substance}}{\frac{1}{12}\times \text{mass of a carbon-12 atom}}$
However, the quantity on the right–hand side is, by definition, the relative atomic (or molecular) mass of a substance. Hence, as claimed:
The mass of one mole of any substance, measured in grams, is numerically equal to the relative atomic (or molecular) mass of that substance.
| Substance | Relative atomic or molecular mass |
Mass of one mole of substance/kg |
|---|---|---|
| carbon-12 | 12.00 | 0.012 00 |
| oxygen-16 (O2) | 32.00 | |
| nitrogen-14 (N2) | 28.02 |
Question T11
Complete Table 1.
Answer T11
For O2, mass of one mole = 0.032 00 kg.
For N2, mass of one mole = 0.028 02 kg.
You will notice from Question T11 that, for example, one mole of nitrogen molecules contains two moles of nitrogen atoms, since nitrogen molecules contain two nitrogen atoms. Now, equipped with a means of describing the quantity of gas in a sample, we can find the relationship between P, V, T and n for an ideal gas. We know that the gas must obey Boyle’s law (Equation 5),
PV = constant(Eqn 5)
which can be written as
PV = (constant)1at fixed T and fixed n(8)
and we will require that it also obeys the simplified form of Charles’ law (Equation 6b),
$\dfrac VT = \text{constant}$(Eqn 6b)
which can be written as
V/T = (constant)2at fixed P and fixed n(9) i
In addition, it seems reasonable to expect that at fixed pressure and fixed temperature, the volume of the sample will be proportional to the quantity of gas, so
V/n = (constant)3at fixed P and fixed T(10)
These three equations are all consistent with one single equation – the equation of state of an ideal gas, which is also called the ideal gas law:
Ideal gas law PV = nRT(11)
where R is a constant known as the molar gas constant or the universal gas constant i and T is the temperature measured on the absolute temperature scale.
Question T12
According to Equation 11,
Ideal gas law PV = nRT(Eqn 11)
what are the values of the three constants that appear in Equations 8, 9 and 10?
PV = (constant)1at fixed T and fixed n(8)
V/T = (constant)2at fixed P and fixed n(9)
V/n = (constant)3at fixed P and fixed T(10)
What are appropriate SI units of measurement for the gas constant R?
Answer T12
According to Equation 11,
PV = nRT(Eqn 11)
So (from Equation 8),
PV = (constant)1at fixed T and fixed n(Eqn 8)
(constant)1 = nRTat fixed T and fixed n;
(from Equation 9),
V/T = (constant)2at fixed P and fixed n(Eqn 9)
(constant)2 = nR/Pat fixed P and fixed n;
(from Equation 10),
V/n = (constant)3at fixed P and fixed T(Eqn 10)
(constant)3 = RT/Pat fixed P and fixed T;
Equation 11 also implies that the SI units of R are equivalent to the units of PV/nT:
$\rm \dfrac{N\,m^{-2}\,m^3}{mol\,K} = N\,m\,K^{-1}\,mol^{-1} = J\,K^{-1}\,mol^{-1}$
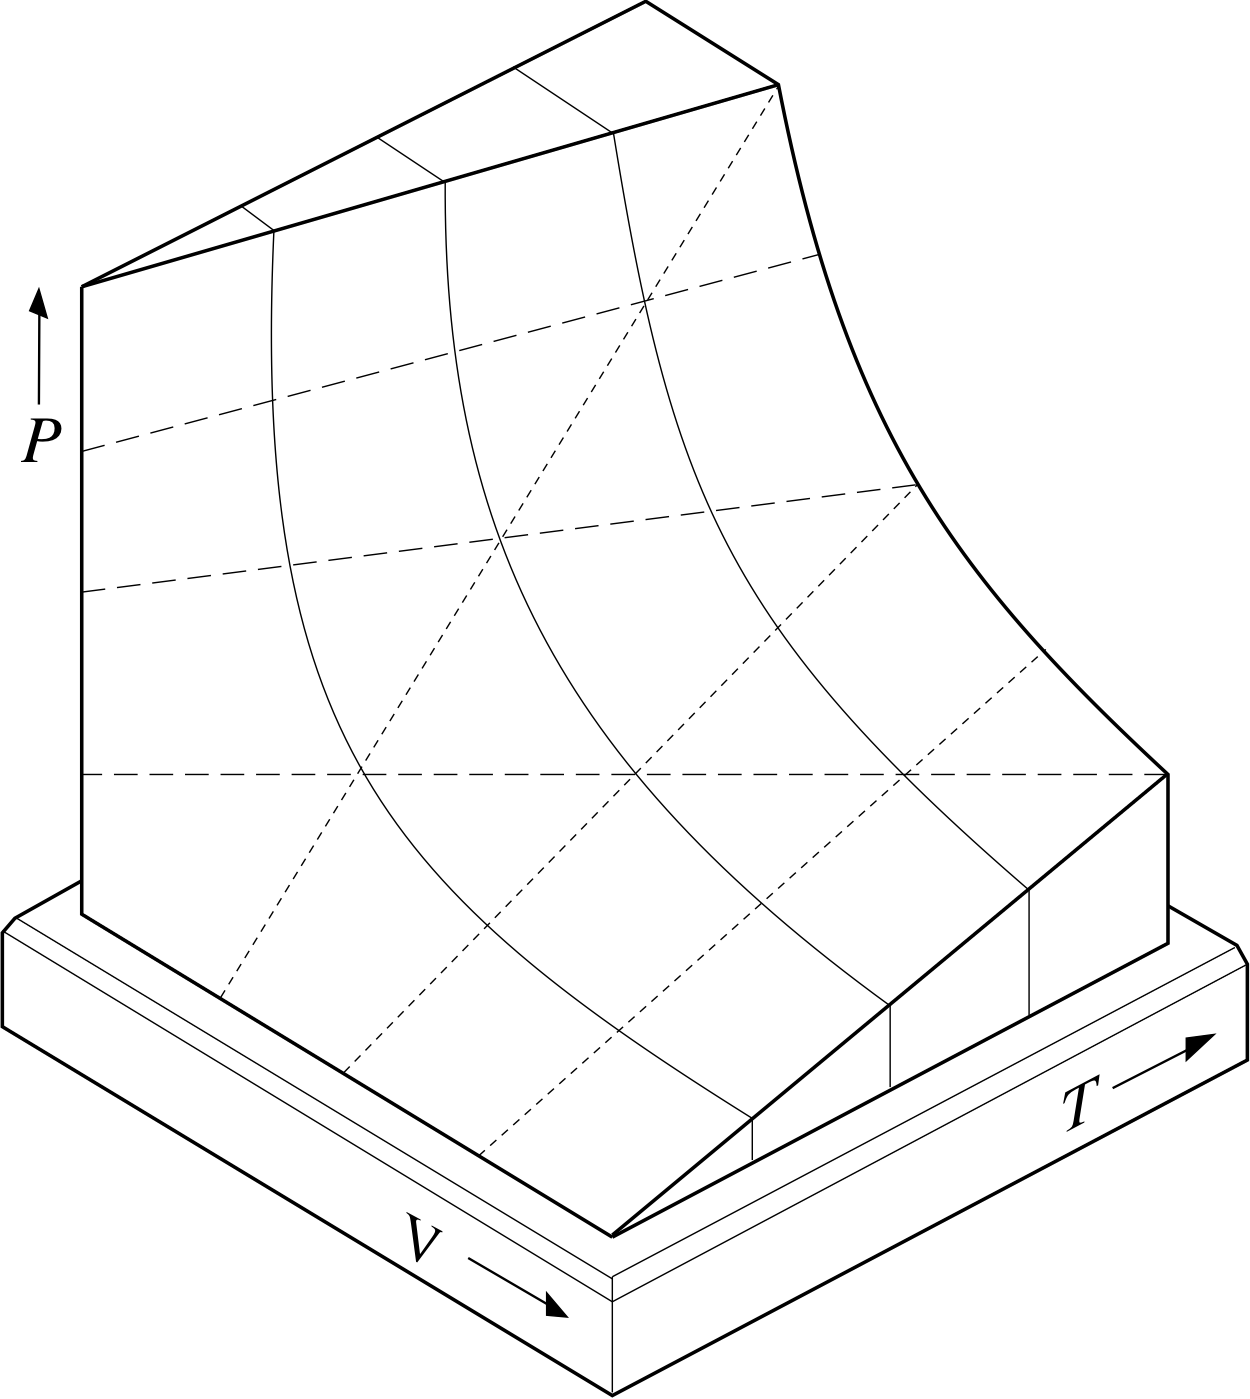
Figure 10 Part of the two–dimensional PVT–surface representing the possible equilibrium states of a given sample of ideal gas. Each point on the full surface corresponds to a set of values of P, V and T that satisfies the ideal gas equation. Points not on the surface do not correspond to any possible equilibrium state of the sample.
Figure 9a The relationship between pressure P and volume V for a fixed quantity of gas at different temperatures. For a fixed volume, the pressure increases with increasing temperature. P is plotted against V.
Figure 10 provides a diagrammatic representation of Equation 11 for a fixed quantity of gas (i.e. fixed n). Each possible combination of values for P, V and T that satisfies the ideal gas equation is represented by a unique point on the surface shown in the figure. In fact, the surface is called the PVT–surface of an ideal gas.
If you examine the surface carefully, you should be able to see that slices taken at different constant temperatures (i.e. cross sections parallel to the PV plane) reveal the hyperbolae shown in Figure 9a and thus embody Boyle’s law.
✦ What shape are the graphs of V against T obtained by slicing the PVT–surface at various fixed values of P? What law do they embody?
Figure 10 Part of the two–dimensional PVT–surface representing the possible equilibrium states of a given sample of ideal gas. Each point on the full surface corresponds to a set of values of P, V and T that satisfies the ideal gas equation. Points not on the surface do not correspond to any possible equilibrium state of the sample.
✧ Since the PVT–surface corresponds to a fixed quantity of gas (i.e. fixed n), it follows from Equation 11 that at fixed P:
V = T × constant at fixed P and fixed n
Thus the V against T graphs are straight lines (as can be seen from the dashed lines in Figure 10) and they embody Charles’ law,
$\dfrac{V}{T} = \rm constant$(Eqn 6b)
The constant would be equal to nR/P in this case.
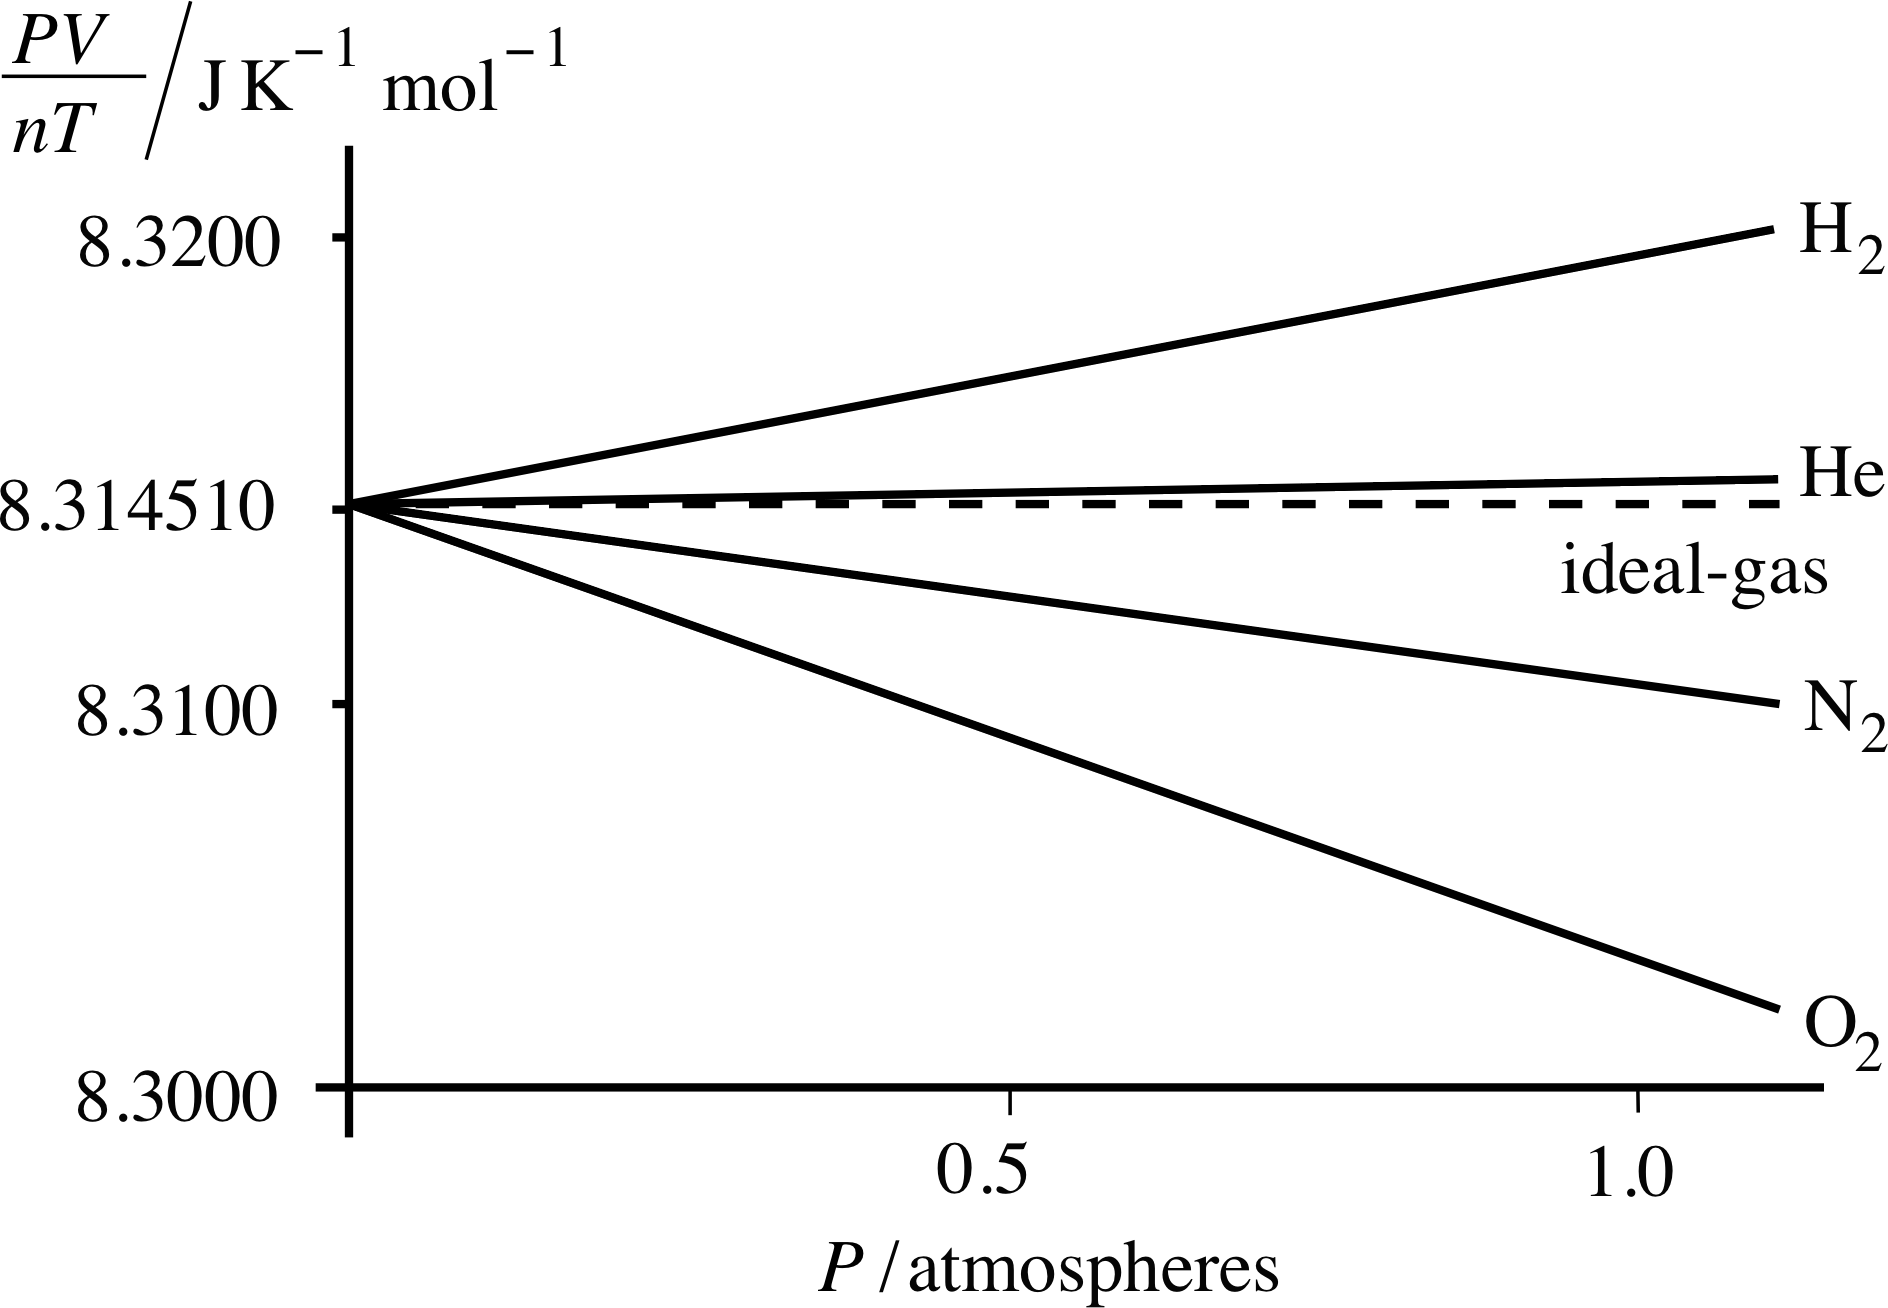
Figure 11 As the pressure falls to zero, the values of PV/nT for all gases tend towards the ideal gas value, namely 8.314 510 J K−1 mol−1.
Of course, Equation 11 and Figure 10 only apply to ideal gases but they indicate the kind of information (equation of state and/or PVT–surface) that we need to describe the behaviour of real gases. Indeed, real gases approximate ideal gases increasingly well as their pressures are reduced towards zero, so to a first approximation Equation 11 and Figure 10 do represent real gases at low pressure.
We can get some idea of how good this ‘first approximation’ is by measuring the quantity PV/nT at various pressures for a variety of real gases and comparing the results with the ideal gas prediction that PV/nT = R.
Some representative data for hydrogen, helium, nitrogen and oxygen are shown in Figure 11. i Even at atmospheric pressure the gases shown in Figure 11 yield values of PV/nT that are within about ±0.1% of the ideal gas value of 8.314 510 J K −1 mol−1, which is the value of PV/nT as P tends to zero. Helium provides a particularly good approximation to the ideal gas throughout the pressure range. Note that as P approaches zero, all the gases approach ideal gas behaviour.
3.6 Using the ideal gas law
The beauty of the ideal gas law, Equation 11,
Ideal gas law PV = nRT(Eqn 11)
is its simplicity. It is easy to make accurate calculations about the behaviour of many real gases under moderate conditions of pressure and temperature (where they still approximate to an ideal gas). Suppose a fixed quantity of such a gas has initial values P1, V1, T1 for pressure, volume and temperature, and something is done which changes those values to P2, V2 and T2 without altering n. We can immediately deduce from Equation 11 that:
$\dfrac{P_1V_1}{T_1} = \dfrac{P_2V_2}{T_2}$ (at fixed n)(12) i
If we know five of these six quantities, we can use Equation 12 to find the remaining quantity.
Question T13
A car’s tyres are filled to a pressure of 3.00 × 10⁵ Pa on a very cold day. After a long drive, during which the tyres became hot and expanded, the air in the tyres has increased its volume by 1% and its (absolute) temperature by 5%. Assuming that the air behaves as an ideal gas under these conditions, what is the pressure in the tyres at the end of the drive?
Answer T13
If the initial volume is V1, the final volume will be V2 = 1.01V2; and if the initial temperature is T1, the final temperature will be T2 = 1.05T1. It then follows from Equation 12,
$\dfrac{P_1V_1}{T_1} = \dfrac{P_2V_2}{T_2}$ (at fixed n)(Eqn 12)
that:
$P_2 = \dfrac{P_1V_1T_2}{V_2T_1} = \dfrac{P_1V_1\times(1.05T_1)}{1.01V_1T_1} = \rm \dfrac{(3.00\times10^5\,Pa)\times1.05}{1.01} = 3.12\times10^5\,Pa$
One final point worth mentioning is that for some purposes, in spite of what was said above, it can be more convenient to work with masses rather than moles. If this is the case, the equation of state can be written in an alternative form. The total mass M of a gas will be given by M = nMm where n is the number of moles and Mm is the molar mass (i.e. the mass per mole, usually measured in units of kg mol−1), so we can replace n in
Equation 11 by M/Mm and write:
PV = MrT(13)
where r = R/Mm is the gas constant per unit mass for the gas concerned. Obviously, this is not a universal constant because Mm is specific to the gas. i
| Substance | Relative atomic or molecular mass |
Mass of one mole of substance/kg |
|---|---|---|
| carbon-12 | 12.00 | 0.012 00 |
| oxygen-16 (O2) | 32.00 | 0.032 00 |
| nitrogen-14 (N2) | 28.02 | 0.028 02 |
Question T14
Using the information in the completed Table 1 calculate the gas constant per unit mass for oxygen and nitrogen.
Answer T14
r = R/Mm.
For oxygen:
r = (8.314 510/0.032 00) J K−1 kg−1 = 259.8 J K−1 kg−1
For nitrogen:
r = (8.314 510/0.028 02) J K−1 kg−1 = 296.7 J K−1 kg−1
3.7 Summary of Section 3
This section has been concerned with the behaviour of gases. In particular it has defined pressure as a measure of the magnitude of the perpendicular force per unit area on a surface, and it has introduced the equation of state of an ideal gas, that is the formula which relates the pressure, volume and temperature for a fixed amount of gas. This equation grew out of Boyle’s and Charles’ laws.
Boyle’s law asserts that when the temperature of a fixed quantity of gas is held constant, the product of its pressure and volume is constant. Charles’ law asserts that when the pressure of a fixed quantity of gas is held constant, the volume is proportional to the quantity (Tcen + 273° centigrade), where Tcen is the centigrade temperature. This suggests that there exists a lowest possible temperature, usually called absolute zero, at about −273° centigrade. By introducing an absolute temperature scale (to be formally defined later) in which temperatures are measured in units called kelvin (K) and on which absolute zero corresponds to 0 K, we can simplify Charles’ law by saying that when the pressure of a fixed quantity of gas is held constant, the ratio of its volume to its absolute temperature is constant.
A mole of gas contains 6.022 045 × 1023 (Avogadro’s number) particles. This number ensures that the mass of one mole of any gas, measured in grams, is numerically equal to its relative atomic or molecular mass.
The equation of state of an ideal gas is often written as PV = nRT where T is the absolute temperature, n is the number of moles of gas and R is the molar gas constant. The value of R is 8.314 510 J K−1 mol −1. At low pressures all real gases approximate ideal gases.
For a fixed quantity of ideal gas the quantity PV/T is a constant.
Question T15
Assume throughout this question that Avogadro’s constant is 6.0 × 10²³ mol −1.
(a) How many helium atoms are there in 4 moles of helium?
(b) Given that the mass of 1 mole of oxygen molecules is 0.032 kg, estimate how many oxygen molecules there are in 0.112 kg of the gas.
(c) What would be the total mass of a sample of gas containing 1.2 × 1024 molecules if its molar mass is 4.0 × 10⁻³ kg mol−1?
Answer T15
(a) 4 moles of helium contain 4 × 6.0 × 1023 = 24 × 1023 helium atoms.
(b) 0.112 kg of oxygen molecules contains (0.112/0.032) moles = 3.50 moles.
Therefore the number of molecules = (3.50 × 6.0 × 1023) = 2.1 × 1024.
(c) Number of moles = (1.2 × 1024/6.0 × 1023) moles = 2.0 moles.
Each mole has a mass of 4.0 × 10⁻³ kg, so the total mass = 2.0 × 4.0 × 10−3 kg = 8.0 × 10⁻³ kg.
Question T16
A weather balloon is filled with helium at an absolute temperature of 290 K to a pressure of 1.0 atm. When on the ground, the volume of this balloon is 10 m3. The balloon then rises to an altitude at which the temperature is 250 Κ and the atmospheric pressure is 190 mmHg. (Recall that 1.0 atm ≈ 760 mmHg.) What would you expect the new volume of the balloon to be?
(Assume that helium behaves like an ideal gas.)
Answer T16
Rearranging Equation 12,
$\dfrac{P_1V_1}{T_1} = \dfrac{P_2V_2}{T_2}$ (at fixed n)(Eqn 12)
gives us:
$V_2 = \dfrac{P_1}{P_2} \times\dfrac{T_2}{T_1}\times V_1$
Therefore V2 is given as:
$V_2 = \rm \left(\dfrac{760}{190} \times \dfrac{250}{290}\times10\right)\,m^3 = 34\,m^3$
(Remember to correct temperatures to absolute values.)
4 Defining temperature scales
4.1 Gas thermometry
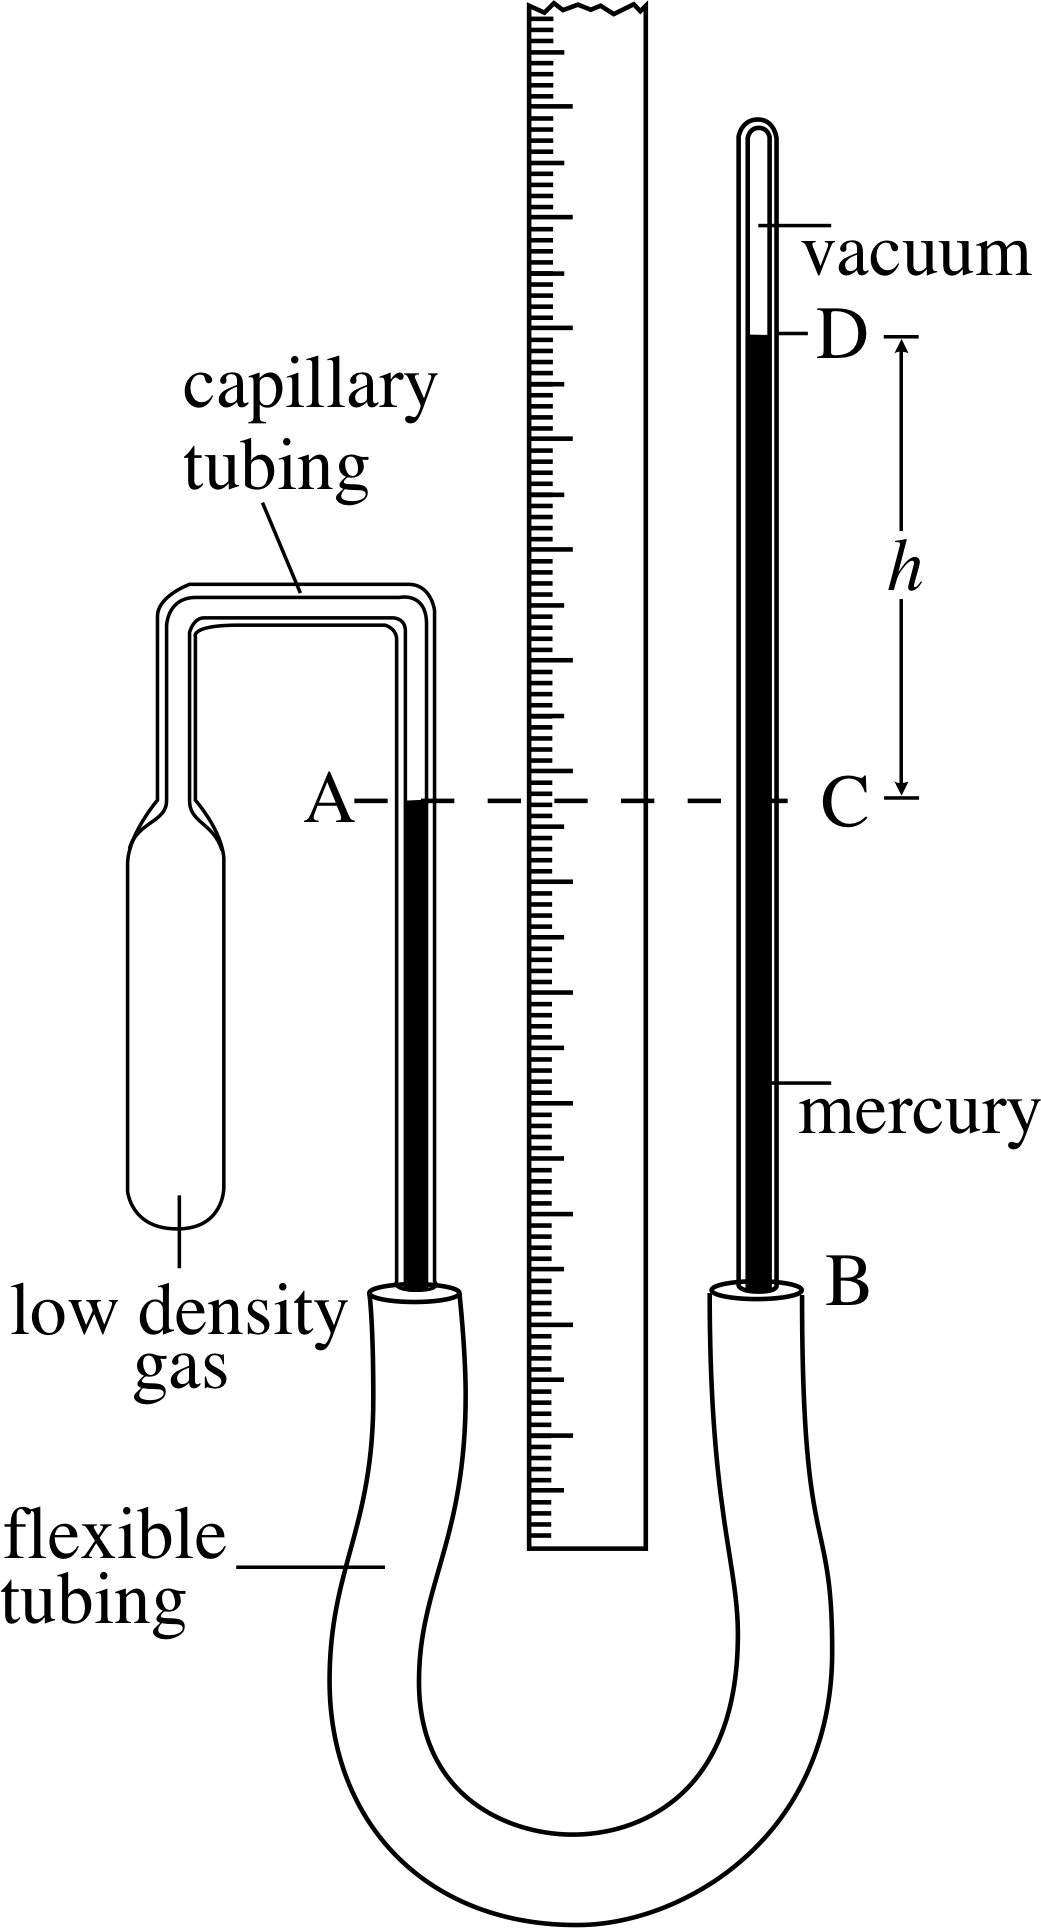
Figure 12 A constant–volume gas thermometer. The pressure of the gas in the bulb is equivalent to h (with units of mmHg, where 760 mmHg ≈ 1 atm ≈ 1.013 × 10⁵ N m−2 = 1.013 × 10⁵ Pa).
Figure 12 shows schematically a constant–volume gas thermometer of the kind first mentioned in Subsection 2.3. Suppose the glass bulb containing the gas (the density of which should be as low as practicable) is placed in hot water. The gas in the bulb will expand, forcing the mercury at A down the tube. If we then raise the tube BD (thus increasing the ‘head of mercury’) until the mercury in the left–hand tube comes back to the mark at A, then the volume of the gas will have been restored to its original value, and the pressure of the gas in the bulb will be given by the new height of the mercury column CD. The higher the temperature of the water into which the bulb has been placed, the greater will be the height CD and the higher will be the pressure of the fixed volume of gas. Thus the pressure of the gas at constant volume, as measured by the height h, is a thermometric property. i
In this section you will learn how gas thermometry can be used to provide a temperature scale that is more fundamental than the centigrade scale we have mainly used so far.
4.2 Advantages of the gas thermometer
In what way might the constant–volume gas thermometer be any better than the other thermometers we have mentioned earlier in the module? At the most obvious level, we might say that it can provide measurements over a much greater temperature range than the mercury-in-glass thermometer. Most of the common gases remain gaseous over a very wide range of temperatures. Helium for example can, with some difficulty, be used for constant–volume gas thermometry to within one degree of absolute zero, and up to several hundred degrees. But there is an even more important reason for preferring a gas thermometer.
Remember what happens when we use different thermometers to measure temperature. The thermometers will not generally agree, except at the calibration points that are common to them all. The discrepancies may be small, but it is hardly satisfactory that the temperature reading provided by a particular thermometer should depend on the details of the working substance (mercury, alcohol, etc.) used in that thermometer. What we really want is a means of measuring temperature that is less arbitrary. In particular, one that is independent of the properties of any particular substance.
Now, at low pressures all gases approximate an ideal gas. So, provided we work at low pressures with a constant–volume gas thermometer, the nature of the working substance is of little relevance. Moreover, if there were some way in which we could use a sequence of measurements performed using a real gas to deduce what an ideal gas would do, then we might even be able to obtain a temperature scale that was truly independent of the real gas.
It turns out that this is indeed possible, as we will explain in the next subsection. Consequently, the constant volume gas thermometer, when used in the right way, can provide a more fundamental measure of temperature than most other thermometers.
4.3 The absolute and Celsius temperature scales
The properties of gases and the fundamental problem of defining a universal temperature scale i are intimately related. They grew up together and they are almost impossible to separate. This is why we have found it necessary to jump backwards and forwards in this module between the basics of thermometry and the properties of gases. Nonetheless, we are now able to define the absolute temperature scale. In order to do so we need to select a thermometric property that can be measured by an appropriate thermometer; we need a thermometric relation that will relate values of the chosen property to temperatures on our chosen scale, and we need an appropriate number of fixed calibration points to determine the numerical values on the chosen scale.
As is already clear, the thermometric property will be the pressure of a fixed volume of gas as measured by a constant–volume gas thermometer, so the only things left to declare are the thermometric relation and the calibration points. Now, because its starting point is absolute zero, the absolute temperature scale requires only one experimental calibration point. As mentioned in Subsection 2.4, neither the melting point of ice nor the boiling point of water are sufficiently reproducible to give the highest precision, so for many years now a different calibration point has been used.
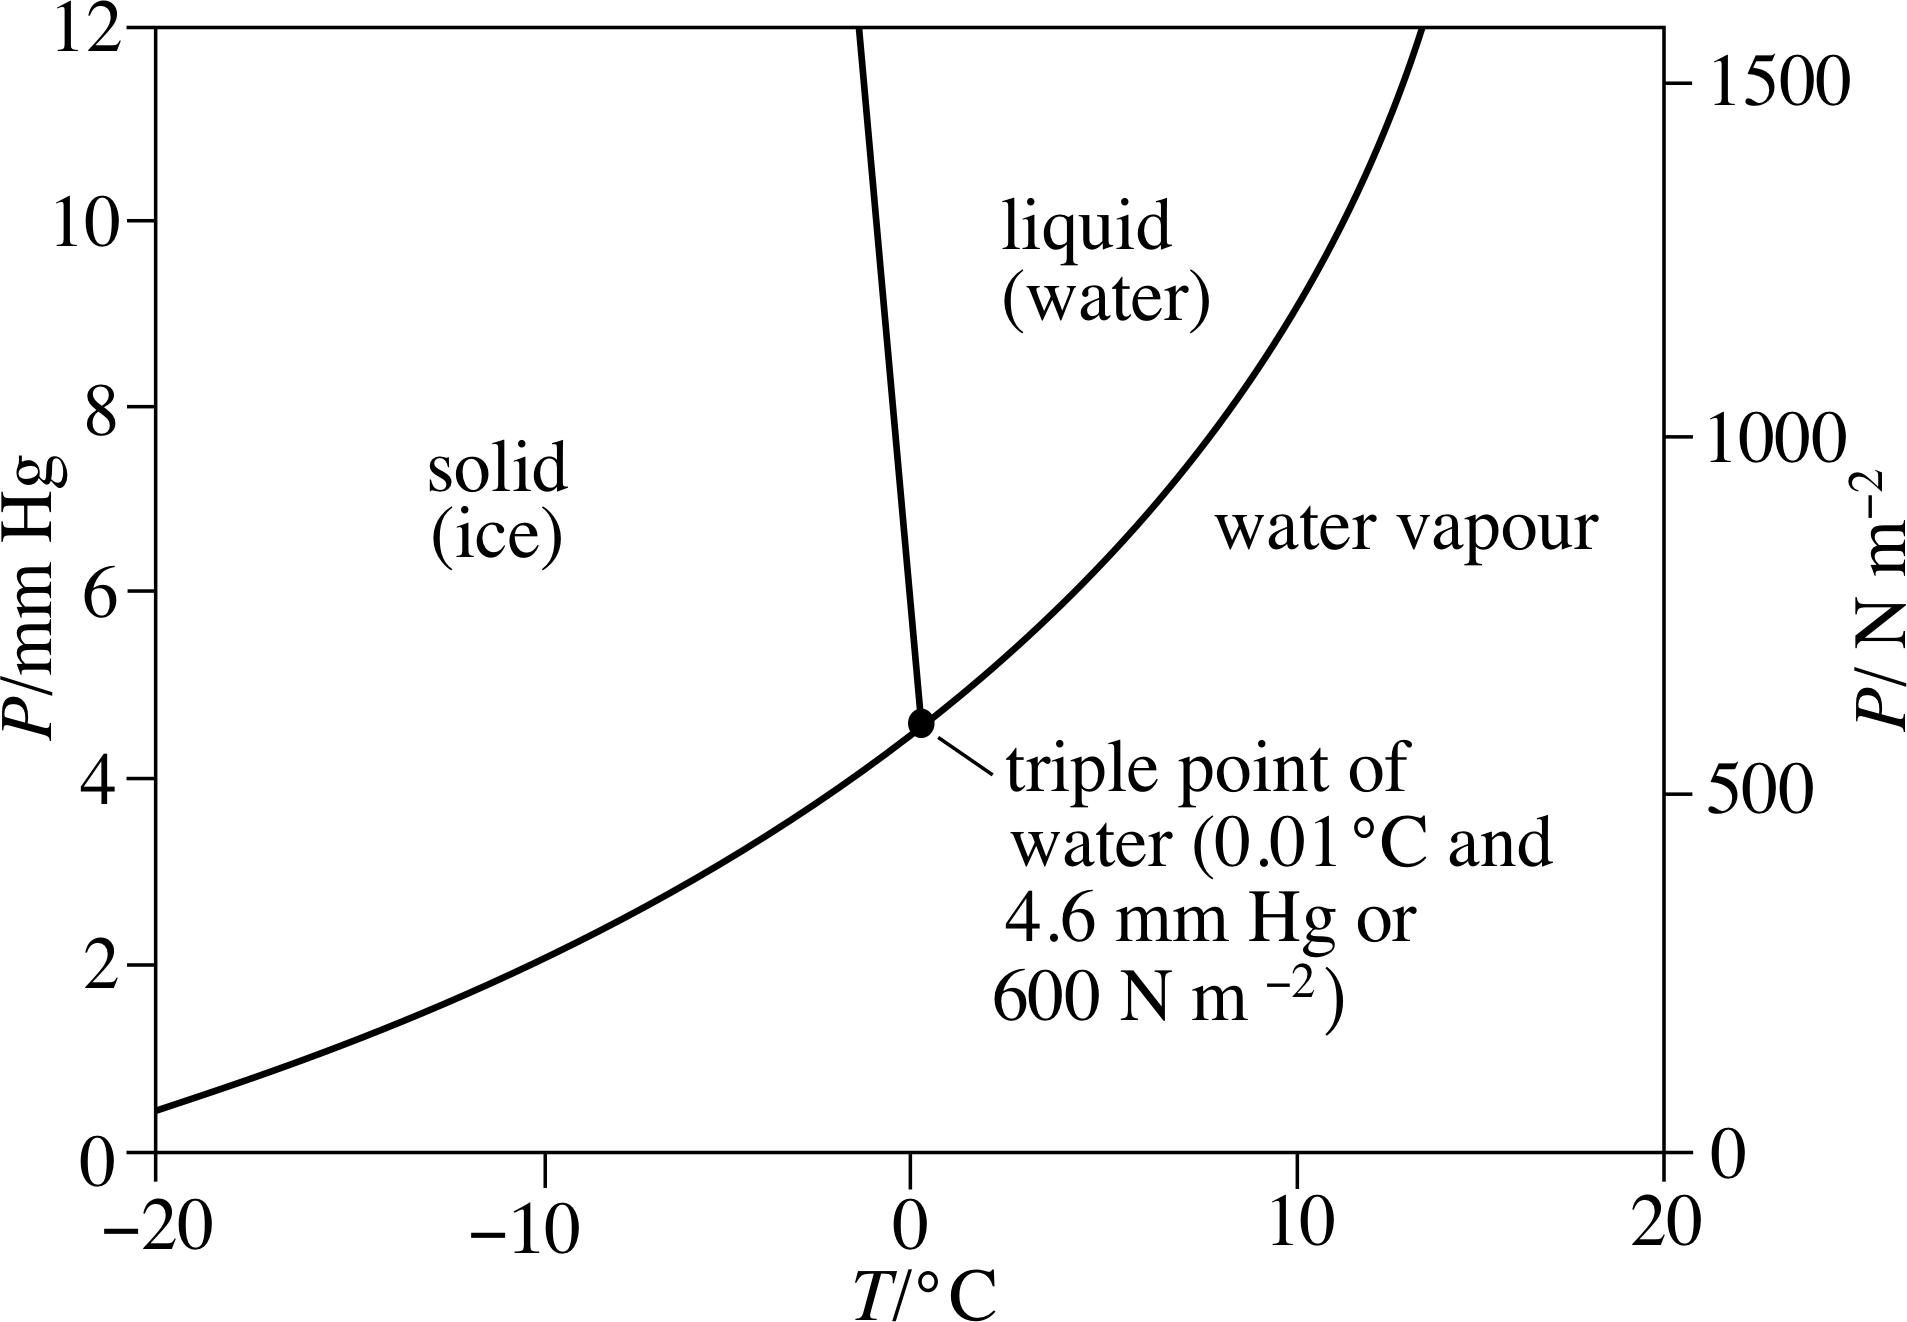
Figure 13 For different combinations of pressure and temperature water may exist in equilibrium as a solid, a liquid or a gas. The triple point of water is that unique combination of temperature and pressure at which ice, water, and water vapour all coexist in thermal equilibrium. (Note that 1 Pa = 1 N m−2)
The standard fixed point of the absolute temperature scale is known as the triple point of water. The significance of this point can be seen in Figure 13, which shows some of the conditions of temperature and pressure under which a fixed quantity of water will exist as a solid (ice), a liquid or a gas (water vapour). Notice that the graph shows low pressures, around 1% of normal atmospheric pressure. As you can see, at these low pressures the temperature at which water boils (i.e. the temperature on the line that separates liquid from vapour) is remarkably low; it’s about 15 °C at 1500 Pa and declines rapidly with falling pressure. But you can also see that the melting temperature, at which water makes the transition from solid (ice) to liquid, increases slightly as the pressure falls. As a consequence, the two lines meet at a temperature of 0.01 °C when the pressure is 600 Pa. Under these unique conditions water vapour, liquid water and solid ice can all coexist in equilibrium.
It is this condition of three–fold coexistence that specifies the triple point of water. The triple–point temperature (0.01 °C) is close to the freezing point of water (at standard atmospheric pressure), but the fact that the triple point naturally corresponds to a unique pressure gives it a great advantage over the normal freezing point which depends on an arbitrarily chosen pressure of 1 atm. The triple point has the added virtue of being very easy to establish experimentally, anywhere in the world. Figure 14 shows a triple–point cell of the type used in national standards laboratories to calibrate their constant–volume gas thermometers. As long as gas, liquid and solid coexist within the cell the temperature in the central well must be the triple–point temperature.
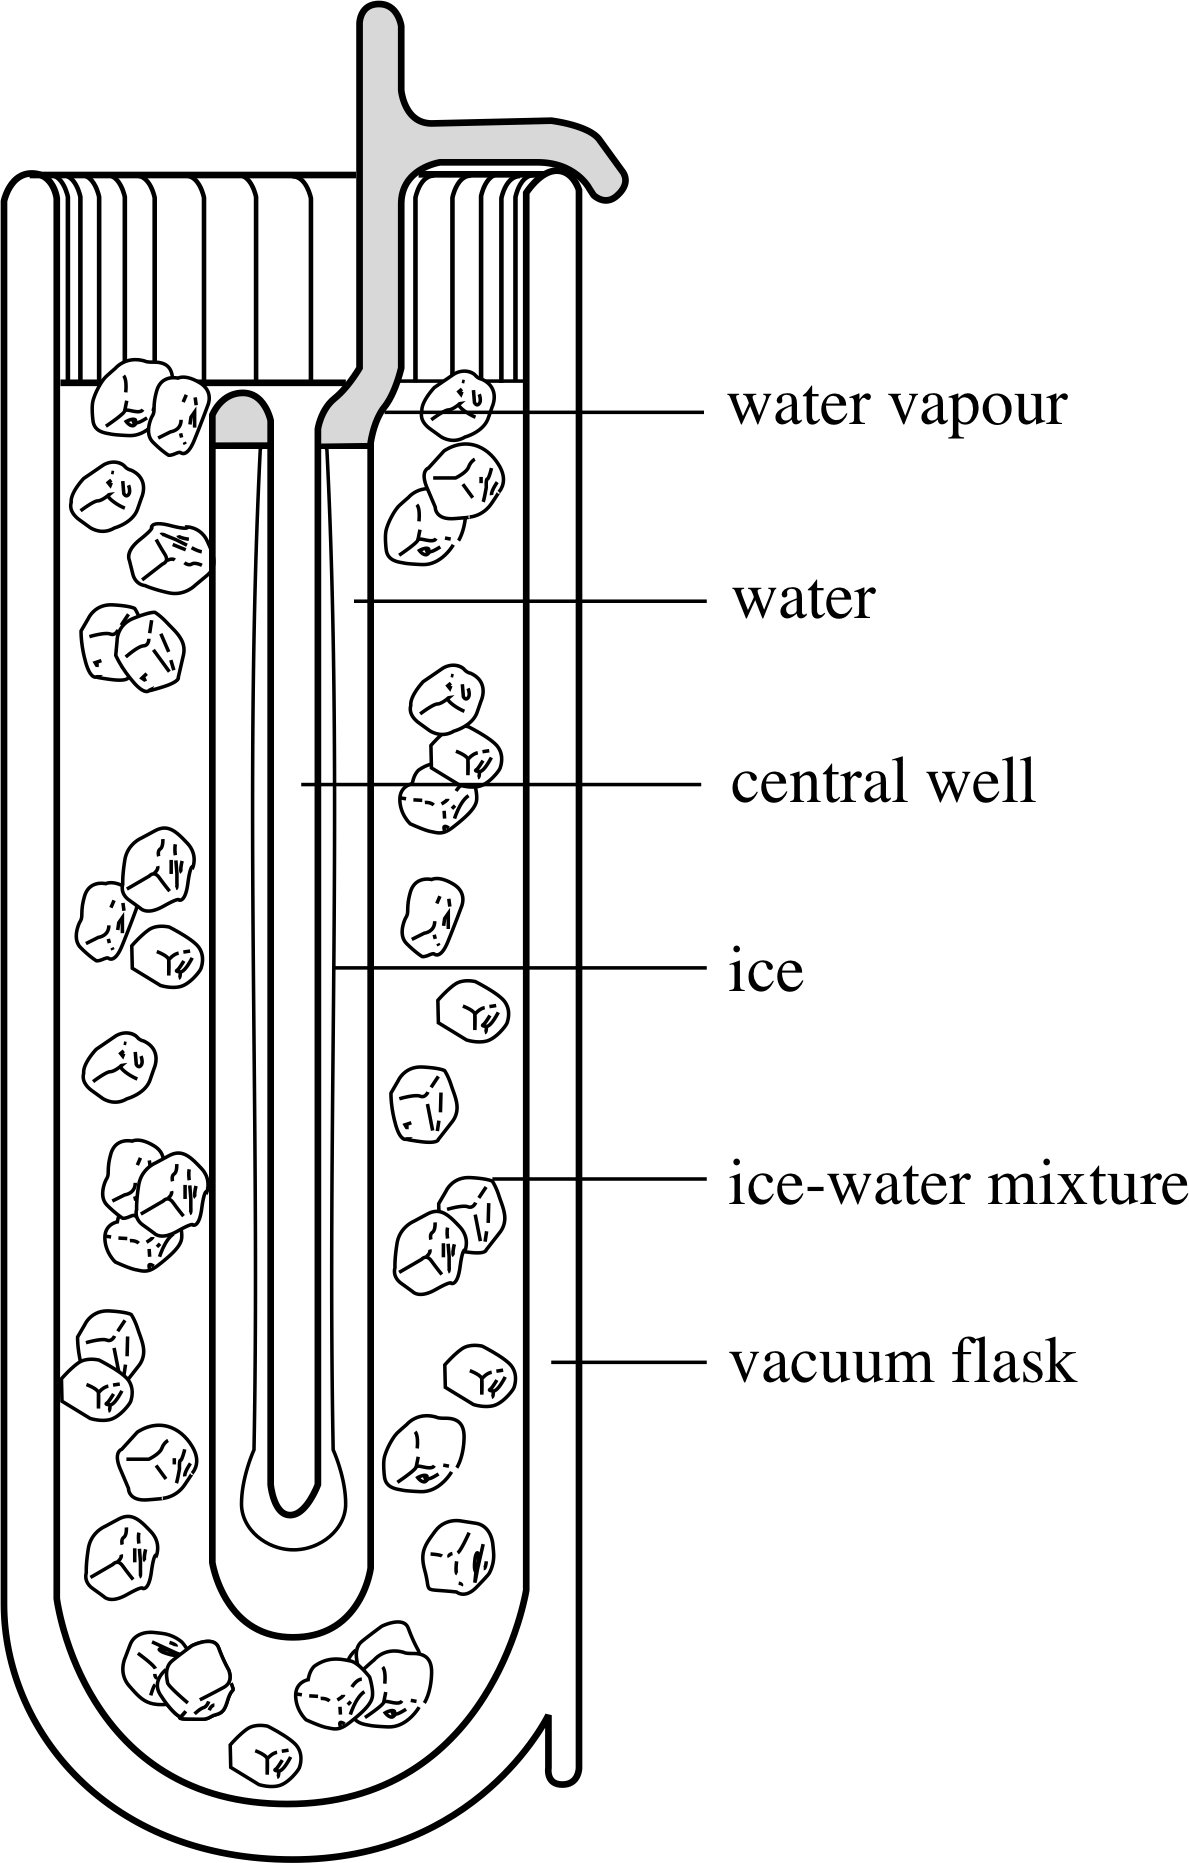
Figure 14 A standard triple–point cell as used in a national standards laboratory.
Having chosen the triple point as the standard fixed point, we now have to assign a value to its absolute temperature. This involves specifying a unit of temperature as well as a numerical value and thus provides an opportunity to get rid of the historical encumbrance of ‘degrees’. The SI unit of temperature introduced by this process is called the kelvin (K) in honour of the Scottish physicist, William_Thomson,_1st_Baron_KelvinWilliam Thomson, Lord Kelvin (1824–1907). By assigning an absolute temperature of 0 K to absolute zero and an absolute temperature of 273.16 K to the triple–point temperature we can ensure that the temperature interval corresponding to 1 K is very close to the interval corresponding to one degree on earlier centigrade scales. Thus, the specification of the triple–point temperature is as follows:
The triple–point temperature of water is defined to be exactly 273.16 K, where K (kelvin) is the SI unit of absolute temperature.
Now we come to the thermometric relation that will enable us to associate absolute temperatures T with the measured values of the pressure P in a constant volume gas thermometer. If we had a gas thermometer filled with ideal gas life would be simple since we could use the ideal gas law to provide a relationship of the form T = P × constant. Unfortunately, gas thermometers must be filled with real gases, so things are a little more complicated. Nonetheless, we can still make use of the simple properties of an ideal gas by using the fact that the behaviour of real gases approaches that of an ideal gas as the pressure is reduced.
The way in which this is achieved in practice is explained below, but we indicate it mathematically by writing the thermometric relation for the ideal gas absolute temperature scale as follows
ideal gas absolute temperature scale
$\displaystyle T= \lim_{P_{\rm triple}\to 0}\left(\dfrac{P}{P_{\rm triple}}\right) \times 273.16\,{\rm K}$(14) i
In this equation P is the gas pressure in the thermometer when it is in contact with the body the temperature of which is to be measured, and Ptriple is the equilibrium gas pressure in the thermometer when placed in the triple–point cell. Note that Ptriple is not the 600 Pa pressure of the water vapour in the triple–point cell itself; both Ptriple and P have to be measured. Also note that to find the temperature it is necessary to work out the value that P/Ptriple would take if the pressure of the gas in the thermometer were reduced to zero – that is indicated by the symbol $\lim_{P_{\rm triple}\to 0}$ which should be read as ‘in the limit as Ptriple tends to zero’. In practice this involves taking a sequence of readings at progressively lower pressures and extrapolating the results to zero pressure.
Figure 12 A constant–volume gas thermometer. The pressure of the gas in the bulb is equivalent to h (with units of mmHg, where 760 mmHg ≈ 1 atm ≈ 1.013 × 10⁵ N m−2 = 1.013 × 10⁵ Pa).
It is instructive to identify the stages in a high precision measurement of temperature using a constant–volume gas thermometer; the measurement of the melting point of sulphur forms a good example. The stages are as follows:
- 1
-
Fill the bulb of the gas thermometer with the chosen gas to a pressure of about one atmosphere at room temperature.
- 2
-
Place the bulb of the gas thermometer into a triple–point cell, allowing the system to stabilize.
- 3
-
Adjust the mercury levels in the thermometer so as to bring the gas to its fixed, constant–volume mark (point A in Figure 12) and allow it to stabilize.
- 4
-
Measure the pressure of the gas in the bulb, Ptriple, at this temperature (i.e. h in Figure 12).
- 5
-
Place the thermometer bulb in melting sulphur.
- 6
-
Adjust the mercury levels to restore the gas to the constant–volume mark and allow it to stabilize.
- 7
-
Measure the new pressure of the gas in the bulb, P.
- 8
-
Calculate the temperature T ́ = (P/Ptriple) × 273.16 K.
- 9
-
Remove about 20% of the gas from the bulb to reduce the pressure.
- 10
-
Repeat steps 2 to 9 several times, writing down T ́ each time.
- 11
-
Plot T ́ against Ptriple as in Figure 15. The extrapolation to zero pressure gives the required temperature (i.e. the temperature that would have been measured had the gas in the thermometer been an ideal gas).
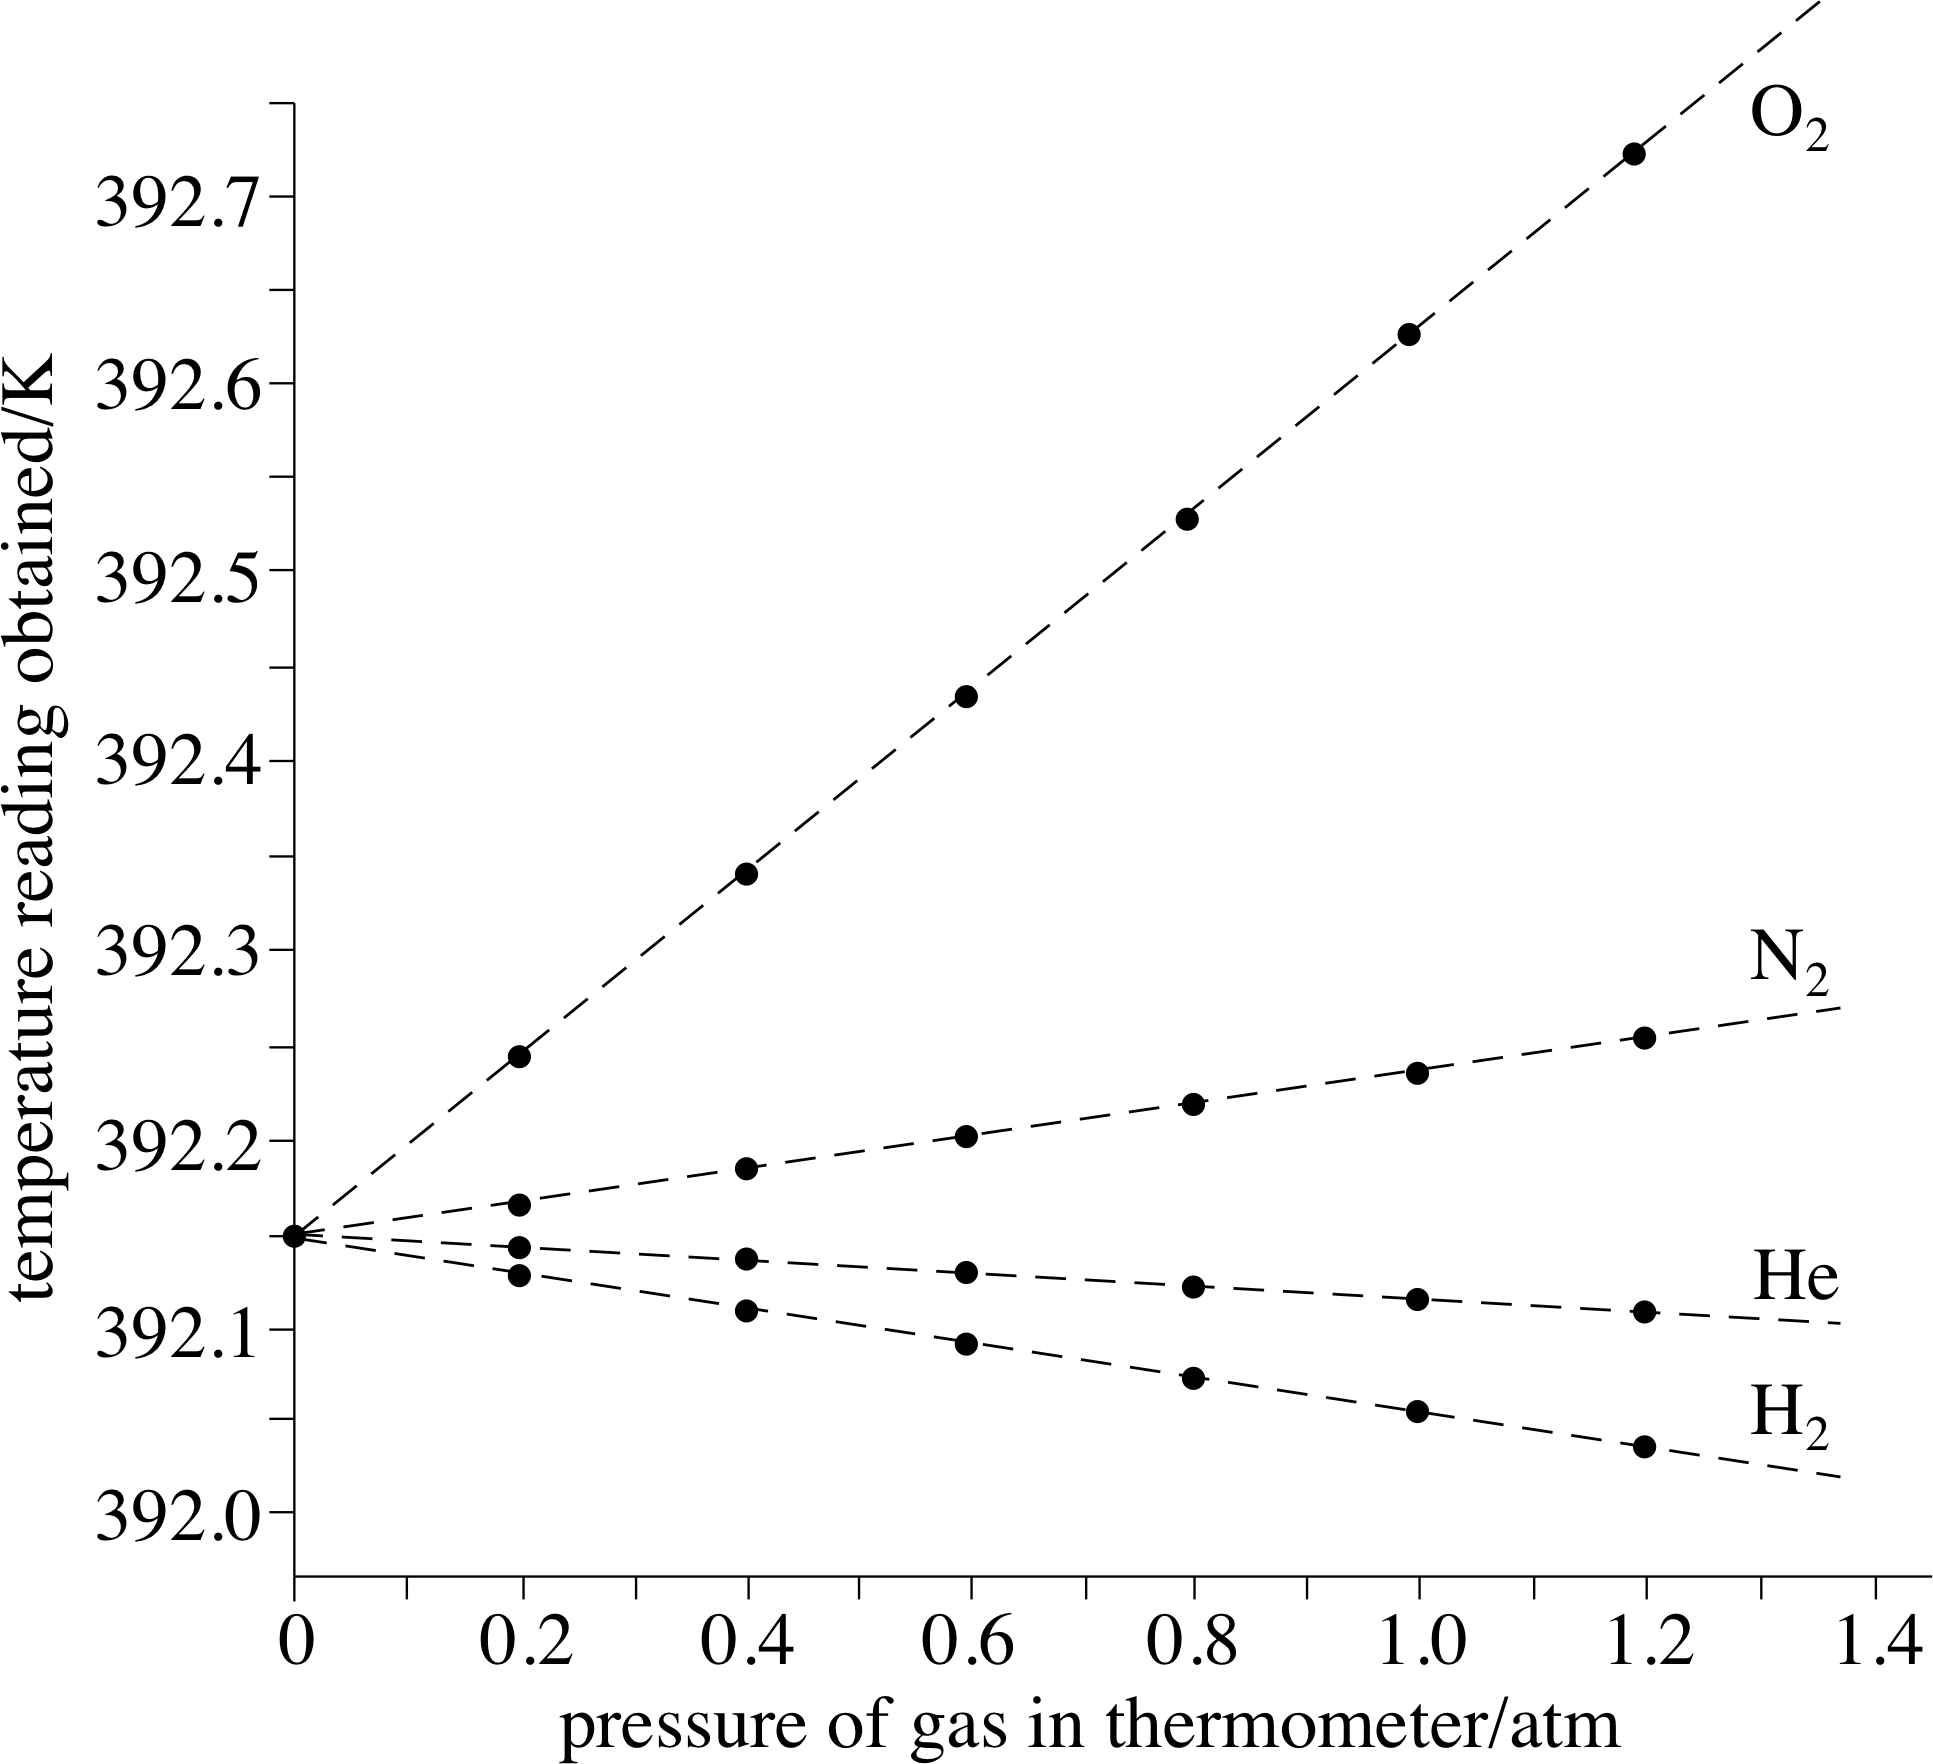
Figure 15 The temperature of the melting point of sulphur obtained with a constant–volume gas thermometer.
Used in this way, and extrapolated to zero pressure, the result is almost independent of the gas used in the thermometer. Even at atmospheric pressure, the discrepancy between different gases is only about half a degree, which for many purposes might not be serious. The gas thermometer may be unwieldy and slow to use but the measurements made with it are precise and reproducible.
After all this it will come as a relief to learn that the Celsius scale, in its modern definition, is simply related to the absolute scale by the relation:
Celsius scalecelsius_temperature_scale TC/°C = T/K − 273.15(15)
TC is the temperature in degrees Celsius and T is the absolute temperature in kelvin, therefore each term in Equation 15 is dimensionless. This is an exact, defined relationship so there is no arguing with it. Notice the appearance of 273.15 in Equation 15, not to be confused with the defined 273.16 which occurs in Equation 14.
$\displaystyle T= \lim_{P_{\rm triple}\to 0}\left(\dfrac{P}{P_{\rm triple}}\right) \times 273.16\,{\rm K}$(Eqn 14)
The triple–point temperature of water (defined as 273.16 K) is about one hundredth of a degree above the measured normal freezing point of water.
In summary, the triple–point temperature of water is defined, but the freezing point and boiling point must be measured. i Originally the freezing and boiling points of water were, by definition, 0° centigrade and 100° centigrade but now they are measured to be 0.00 ° C and 99.98 ° C. The Celsius scale is therefore not a centigrade scale because there are no longer 100 ° C between the freezing and boiling points of water.
Question T17
| Gas pressure P at the boiling point of sulphur/kN m−2 |
Gas pressure at the triple point of water/kN m−2 |
|---|---|
| 300.000 | 114.214 |
| 200.000 | 76.131 |
| 100.000 | 38.060 |
A constant–volume hydrogen thermometer is used to determine, as accurately as possible, the normal boiling point of sulphur. Three different measurements are made of the gas pressure in the thermometer bulb when it is in the vaporizing sulphur. For each of these measurements, there is a different, selected, amount of gas in the bulb. For each of these same amounts of gas the pressures are measured with the bulb in a triple–point cell. The results are given in Table 2.
Determine the boiling point of sulphur on the ideal–gas absolute temperature scale.
| P/kN m−2 | Ptriple/kN m−2 | P/Ptriple |
|---|---|---|
| 300.000 | 114.214 | 2.62665 |
| 200.000 | 76.131 | 2.62705 |
| 100.000 | 38.060 | 2.62743 |
Answer T17
The values of P/Ptriple corresponding to the three measurements are summarized Table 4.
For the best estimate of T, we need the value of P/Ptriple as Ptriple tends to zero. This could be done by plotting a graph of P/Ptriple against Ptriple and extrapolating to Ptriple = 0. You should find this gives a value of 2.627 79. Substituting this in Equation 14,
$\displaystyle T= \lim_{P_{\rm triple}\to 0}\left(\dfrac{P}{P_{\rm triple}}\right) \times 273.16\,{\rm K}$(Eqn 14)
gives T = 2.62779 × 273.16 K = 717.81 K.
Figure 11 As the pressure falls to zero, the values of PV/nT for all gases tend towards the ideal gas value, namely 8.314 510 J K−1 mol−1.
Figure 15 The temperature of the melting point of sulphur obtained with a constant–volume gas thermometer.
Question T18
Four different constant–volume thermometers are filled respectively with oxygen, nitrogen, helium and hydrogen and are used to measure the boiling point of water at 1 atm.
(a) The quantity of gas in each bulb of the thermometers is adjusted to give a pressure reading of 0.5 atm at the temperature of boiling water. The pressure reading at the triple–point temperature is then found for all four thermometers, and the temperature of the boiling water calculated, in each case, from Equation 14.
$\displaystyle T= \lim_{P_{\rm triple}\to 0}\left(\dfrac{P}{P_{\rm triple}}\right) \times 273.16\,{\rm K}$(Eqn 14)
Would these thermometers agree on this temperature and, if not, which would give the temperature that approximates most closely to the ideal–gas absolute temperature scale?
[Hint: Look at Figures 11 and 15.]
(b) Suppose all four thermometers are now used in such a way that at least five values of the ratio P/Ptriple, at ever decreasing values of Ptriple, are obtained for all four thermometers.
Which thermometer would now give the temperature most closely approximating to the ideal gas absolute temperature scale?
Answer T18
(a) The thermometers certainly would give (slightly) different answers because of the small departures from an ideal gas for all four gases. The most ideal–like result would be that taken using helium, with nitrogen not far behind. Realistically, however, there would be very little to choose between the results.
(b) Taking several readings for different values of Ptriple allows the ratio P/Ptriple to be extrapolated back to zero pressure. Under these conditions all four thermometers should give results which are virtually identical.
4.4 The thermodynamic Kelvin temperature scale
The thermodynamic Kelvin temperature scale is based on a more fundamental definition of temperature than the ideal gas thermometer, but over a very wide temperature range there is no measurable difference between them. Indeed, the ideal gas absolute scale can be regarded as an offshoot of the Kelvin scale. It might be thought unnecessary to go beyond the ideal gas absolute scale, but there are at least two respects in which the Kelvin scale has marked superiority, even though it is rarely used.
First, the thermodynamic Kelvin temperature scale is based on the properties of matter generally rather than the properties of one particular type of matter (gas). It depends on well–established thermodynamic principles stemming from the work of Sadi Carnot (1796–1832). Lord Kelvin first proposed the scale in 1848. Nowadays, we might write it as follows:
thermodynamic kelvin temperature scale
$T = \left(\dfrac{Q}{Q_{\rm triple}}\right)\times 273.16\,{\rm K}$(16)
where Q and Qtriple represent the amounts of heat that flow into or out of a system, under carefully defined conditions, at the measurement temperature and at the triple–point temperature of water, respectively. Precisely what these conditions are is beyond the scope of this module. i
Equation 16 is very much like Equation 14,
$\displaystyle T= \lim_{P_{\rm triple}\to 0}\left(\dfrac{P}{P_{\rm triple}}\right) \times 273.16\,{\rm K}$(Eqn 14)
differing only in that the measurement has to be of heat flow rather than pressure and there is no need to take the limiting values for heat flows. The exact experimental procedure need not concern us here, but it is remarkable to note that in the right conditions Equation 16 is true for any material.
Second, the Kelvin scale is not limited in range as is the ideal gas scale. The latter cannot be used at very low temperatures, below which all gases condense, or at very high temperatures, where all gases become ionized. The Kelvin scale is not limited in this way, precisely because it can be used with any material, even though in practice there may be formidable technical problems. The most useful application of the Kelvin scale so far has been in the measurement of temperatures close to absolute zero.
4.5 The International Practical Temperature Scale of 1990 (IPTS–90)
As with all other SI units, temperature units must be established and maintained in terms of reproducible standards which can be compared with each other to high precision and which may be used to calibrate thermometers. Different thermometers are best suited to specific temperature ranges and the International Practical Temperature Scale 1990 (IPTS–90) summarizes the internationally agreed standards for the best practical methods of temperature measurement for various temperature ranges. This book of rules is very detailed but you may be interested to know which thermometers are specified and over which temperature ranges. The procedures allow for some degree of overlap between the thermometers specified. Temperatures derived according to the rules of IPTS–90 are denoted by T90. In summary, the situation is:
- Between 0.65 K and 5.0 K, T90 is defined in terms of the vapour pressure variation of helium-3 and helium-4 (two isotopes of helium).
- Between 3.0 K and the triple point of neon (24.5561 K), T90 is defined by means of a helium gas thermometer, calibrated at three experimentally realizable temperatures as fixed points.
- Between the triple point of hydrogen (13.8033 K) and the freezing point of silver (961.93 ° C), T90 is defined by means of platinum resistance thermometers calibrated at specified sets of defining fixed points. i
- Above the freezing point of silver (961.93 °C), T90 is defined in terms of a defining fixed point and the spectrum of emitted radiation by means of pyrometry.
4.6 Summary of Section 4
This section has been concerned entirely with the fundamentals of thermometry. We started with the constant–volume gas thermometer, based on the equation of state of an ideal gas, and used it to define the absolute temperature as proportional to the limitingly low pressure of a gas held at constant volume. Equation 14,
$\displaystyle T= \lim_{P_{\rm triple}\to 0}\left(\dfrac{P}{P_{\rm triple}}\right) \times 273.16\,{\rm K}$(Eqn 14)
and the procedure which follows it, tell us what has to be done to measure a temperature T. Only one calibration point is required, in addition to absolute zero, and that is the temperature of the triple point of water, defined as 273.16 K.
The Celsius scale is derived from and related to the absolute scale by the defining relationship TC/°C = T/K − 273.15 where TC is temperature in °C and T is the absolute temperature in kelvin. Thus the Celsius temperature of the triple point of water is (273.16 − 273.15) °C = 0.01 °C.
More fundamental than the absolute scale is the thermodynamic Kelvin scale which can, in principle at least, be used at any temperature and with any material. The scale is identical with the ideal gas scale where they overlap but it is not limited by the non–ideality of real gases. The thermodynamic Kelvin scale is rarely used in practice (although physicists who study low temperatures have applied it in situations in which all gases have condensed) but it is important in underpinning the science of thermodynamics.
Finally, midway between the everyday practicalities of mercury-in-glass thermometers and the academic attractions of the thermodynamic Kelvin scale, there is international agreement about an extensive set of procedures and recommendations on the methods to be used where it is important to know a temperature as accurately as currently possible. This agreement covers a very wide range of temperatures, from 0.65 K upwards, with methods that include gas thermometry, electrical resistance thermometry, and optical pyrometry. The procedures are of particular concern to national standards laboratories, responsible for calibrating practical thermometers for all the many activities that need them.
5 Closing items
5.1 Module summary
- 1
-
The twin objectives of the module have been to make you comfortable with the concept and measurement of temperature, and to introduce the equation of state of an ideal gas.
- 2
-
The existence of temperature is strongly suggested by our own physical experience of it, but the logical underpinning by the zeroth law of thermodynamics puts it on a firm foundation. When two bodies are brought into thermal contact heat flows from the body with the higher temperature to the body with the lower temperature. When heat ceases to flow the two bodies are said to be in thermal equilibrium and are at the same temperature.
- 3
-
Many physical properties of materials can be used operationally to define a temperature scale, for example, thermal expansion, electrical resistance or emitted radiation.
- 4
-
Pressure is defined as the magnitude of the perpendicular force per unit area on a surface. The pressure at a point in a fluid (liquid or gas) in equilibrium is independent of direction.
- 5
-
Boyle’s law and Charles’ law combine to give PV = nRT as the equation of state of an ideal gas, where T is the absolute temperature of the gas, R is the universal gas constant and n is the quantity of the gas in moles. (One mole of any gas contains Avogadro’s number of atoms or molecules, and the mass in grams of one mole of any gas is equal to its relative atomic or molecular mass.)
- 6
-
The equation of state of a fixed quantity of ideal gas, in the form PV/T = constant, allows some useful analysis of gas behaviour in some familiar examples including tyres, balloons, atmospheres, etc.
- 7
-
The constant-volume gas thermometer makes use of the equation of state of an ideal gas. It is especially important because it is, to a good approximation, independent of the choice of gas and can be used over a very wide temperature range.
- 8
-
The ideal gas absolute temperature scale uses the kelvin as the unit of temperature and temperature difference. It assigns the value 0 K to absolute zero and 273.16 K to the triple-point temperature of water.
- 9
-
More fundamental than the absolute scale is the Subsection 4.4thermodynamic Kelvin temperature scale which is entirely independent of the choice of material. The Kelvin scale is in good agreement with the absolute scale where the absolute scale is valid but it can also be applied in situations where the ideal gas relationship breaks down.
- 10
-
The Subsection 4.5International Practical Temperature Scale IPTS–90 summarizes the internationally agreed standards for the best practical methods of temperature measurement for various temperature ranges.
5.2 Achievements
Having completed this module, you should be able to:
- A1
-
Define the terms that are emboldened and flagged in the margins of the module.
- A2
-
Explain how the zeroth law of thermodynamics supports our subjective experience of temperature.
- A3
-
Describe several different types of thermometer, comment on how they are calibrated on a centigrade scale, and explain why they would not all agree at all temperatures.
- A4
-
Show that the pressure exerted at a point in a fluid acts equally in all directions and show that the change of pressure over a small height interval δh in a fluid due to gravity is ρgδh, where ρ is the fluid density and g is the magnitude of the acceleration due to gravity.
- A5
-
Write down the equation of state of an ideal gas and show how it is related to Boyle’s and Charles’ law.
- A6
-
Carry out simple calculations based on the equations P1V1/T1 = P2V2/T2 = nR.
- A7
-
Explain what is meant by a centigrade scale, the ideal–gas absolute scale, the Celsius scale, and the thermodynamic Kelvin scale.
- A8
-
Describe the procedure for the accurate measurement of temperature using a constant–volume gas thermometer.
- A9
-
Explain why the gas thermometer is regarded as more fundamental than other thermometers such as the mercury-in-glass thermometer.
- A10
-
Explain why the thermodynamic Kelvin scale is regarded as more fundamental than the ideal gas temperature scale.
- A11
-
Describe what is meant by the IPTS–90 temperature scale.
Study comment You may now wish to take the following Exit test for this module which tests these Achievements. If you prefer to study the module further before taking this test then return to the topModule contents to review some of the topics.
5.3 Exit test
Study comment Having completed this module, you should be able to answer the following questions each of which tests one or more of the Achievements.
Question E1 (A1 and A2)
What is the zeroth law of thermodynamics and why is it relevant to the definition of temperature as a property, and to the definitions of temperature scales?
Answer E1
The zeroth law of thermodynamics states that if two bodies can be shown separately to be in thermal equilibrium with a third body, then they will be in thermal equilibrium with each other. This law allows us to discuss thermal equilibrium between bodies which may never be brought into thermal contact. We can then begin to define temperature in terms of thermal equilibrium by saying that two objects which are in thermal equilibrium have the same temperature. The zeroth law also suggests the idea of a test device (a thermometer) which can be brought into thermal equilibrium with different objects. Variations in some physical property of the thermometer can be used to define a temperature scale.
(Reread Subsections 2.1 to 2.4 if you had difficulty with this question.)
Question E2 (A3, A8 and A9)
(a) List four thermometric properties which are used in measuring temperatures.
(b) Explain why certain thermometric properties of a gas are often preferred in constructing standard temperature scales.
(c) Explain what is meant by a fixed point and by the triple point of water.
(d) Draw and label a schematic diagram of a constant–volume gas thermometer, and describe how it is used to determine the boiling point of a liquid on the ideal–gas absolute scale.
(e) Compare the advantages and disadvantages of the constant–volume gas thermometer with a mercury-in-glass thermometer.
Answer E2
(a) Examples include: length of a mercury column, gas pressure, electrical resistance and emitted radiation.
(b) Gases are used in preference because at low pressures the variation of gas pressure or volume with temperature is easily calculated and is, to a good approximation, independent of the gas used.
(c) A fixed point is a point used in calibrating a temperature scale. It is assigned a specific temperature and should be easily and accurately reproducible. The triple point of water is used as a fixed point in a number of temperature scales. It is that combination of temperature and pressure at which ice, water and water vapour can coexist in equilibrium.
(d) See Figure 12 and Subsection 4.3.
(e) The constant–volume gas thermometer is highly precise and reliable. On the other hand it is bulky, awkward to use, takes a long time to come to equilibrium and is not portable.
The mercury-in-glass thermometer is portable, easy to use, responds rapidly but is less accurate and the scale is specific to the expansion properties of mercury.
(Reread Subsections 2.5, 4.1 and 4.2 if you had difficulty with this question.)
Question E3 (A5, A6 and A8)
The pressures recorded in a certain constant–volume gas thermometer at the triple point of water and at the boiling point of a liquid were 600 mmHg and 800 mmHg, respectively. What is the apparent temperature of the boiling point? If it were subsequently found that the volume of the thermometer had increased by 1% between the two temperatures, obtain a better value of the boiling point.
Answer E3
Using Equation 14,
$\displaystyle T= \lim_{P_{\rm triple}\to 0}\left(\dfrac{P}{P_{\rm triple}}\right) \times 273.16\,{\rm K}$(Eqn 14)
we find
T = 273.16 × (800/600) K = 364 K
A 1% increase in volume will cause a 1% increase in temperature (Charles’ law), so the new value is T = 368 K.
(Reread Subsection 4.3 if you had difficulty with this question.)
Question E4 (A3)
| Property measured | Steam point (100 °centigrade) |
Ice point (0 °centigrade) |
Room temperature |
|---|---|---|---|
| resistance of resistance thermometer |
75.000 Ω | 63.000 Ω | 64.992 Ω |
| pressure | 1.10 × 10⁷ Pa | 8.00 × 10⁶ Pa | 8.51 × 10⁶ Pa |
Using the data in Table 3, which refer to the observations of a particular room temperature using two types of thermometer, calculate the room temperature on the centigrade scale of the resistance thermometer and on the centigrade scale of the constant–volume gas thermometer. Why do these values differ slightly?
Answer E4
With the resistance thermometer, room temperature is given as:
100 °centigrade × (64.992 − 63.000)/(75.000 − 63.000) = 16.60 °centigrade
With the constant–volume gas thermometer, room temperature is given as:
100 °centigrade × (8.51 − 8.00)/(11.00 − 8.00) = 17.00 °centigrade
They differ because the two thermometric properties vary differently with temperature.
(Reread Subsection 2.4 if you had difficulty with this question.)
Question E5 (A6)
A vessel containing air is sealed off at 100 °C, at which temperature the pressure of the air is 400 mmHg.
To what temperature must the vessel be raised in order that the air pressure will be 760 mmHg?
Answer E5
Converting temperatures into the absolute scale, we find:
$T_2 = T_1\times\dfrac{P_2}{P_1} = \rm 373\times\dfrac{760}{400}\,K = 709\,K~or~436°C$
(Reread Subsection 3.6 if you had difficulty with this question.)
Question E6 (A6)
For 1.0 kg of argon at a pressure of 1.0 × 10⁵ Pa and a temperature of 17°C, calculate (a) the number of moles of argon, (b) the number of atoms of argon, (c) the gas constant per unit mass for argon.
[Hint: Argon is an monatomic gas (i.e. it consists of individual atoms) with relative atomic mass = 39.95 and R = 8.314 J K −1 mol −1.]
Answer E6
(a) Mass of 1 mole of argon = 39.95 g = 0.039 95 kg. Therefore the number of moles in 1.0 kg is (1.0/0.039 95) moles = 25 moles.
(b) Number of atoms in this sample = 25 mol × NA = 25 × 6.02 × 1023 = 1.5 × 1025.
(c) The gas constant per unit mass is:
r = R/Mm = (8.314/0.039 95) J K−1 kg−1 = 208.1 J K−1 kg−1.
(Reread Subsections 3.6 if you had difficulty with this question.)
Question E7
(A7) Explain the difference between 50 °centigrade and 50 °C.
Answer E7
A centigrade scale divides the variation in a thermometric property between two fixed points into 100 equal intervals. The fixed points are usually the freezing and boiling points of water at a pressure of 11atm.
The Celsius scale is derived from the absolute temperature scale by subtracting 273.15. Thus 50 °centigrade will correspond to a value of the thermometric property exactly halfway between 0 °centigrade and 100°centigrade. This may vary depending on the thermometric property used. 50°C is equivalent to an absolute temperature of 323 K and is defined independent of the measuring device.
(Reread Subsection 4.3 if you had difficulty with this question.)
Question E8 (A11)
List the recommended standard temperature measuring techniques for the following temperatures: 1.0 K, 25 K, 100 °C, 2000 K.
Answer E8
The recommended measurement standards are:
1.0 Kvapour pressure of helium
25 Kplatinum resistance thermometry
100 °Cplatinum resistance thermometry
2000 Kpyrometry
(Reread Subsection 4.5 if you had difficulty with this question.)
Question E9 (A4 and A6)
A uniform, vertical glass tube, open at the lower end and sealed at the upper end, is lowered vertically into sea-water, thus trapping the air in the tube. It is observed that when the lower end of the tube is submerged to a depth of 10 m, the sea–water has filled the lower half of the tube. To what depth must the lower end of the tube be lowered so that sea–water fills three–quarters of the tube? Assume that the temperature is independent of depth.
Answer E9
Let the initial volume of the tube be V0 and the atmospheric pressure be P0. At a depth of 10 m, the new volume is V1 = V0/2 so from Boyle’s law the new pressure is P1 = 2P0. P0 of this comes from the atmosphere and P0 from the 10 m of sea-water. When the sea–water fills 3/4 of the tube, the volume has halved again, so V2 = V0/4, therefore P2 = 4P0. Again P0 is due to the atmosphere, so 3P0 has to come from the weight of water. 10 m of water give a pressure of P0, so to get a pressure of 3P0 the depth must be 30 m.
(Reread Subsections 3.1, 3.3 and 3.4 if you had difficulty with this question.)
Study comment This is the final Exit test question. When you have completed the Exit test go back and try the Subsection 1.2Fast track questions if you have not already done so.
If you have completed both the Fast track questions and the Exit test, then you have finished the module and may leave it here.
Study comment Having seen the Fast track questions you may feel that it would be wiser to follow the normal route through the module and to proceed directly to the following Ready to study? Subsection.
Alternatively, you may still be sufficiently comfortable with the material covered by the module to proceed directly to the Section 5Closing items.