


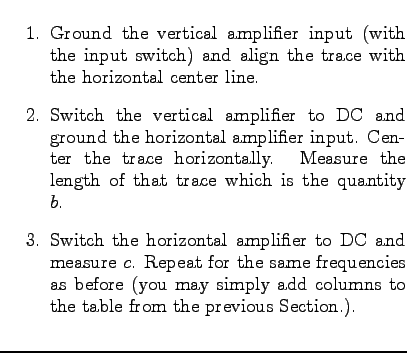
An easy way to perform the measurement is as follows:
![$\textstyle \parbox{2.0in}{\raisebox{-2.2in}{\includegraphics[height=2.0in]{FIGS/fig1.3.ps}}}$](img24.png)
| Frequency, |
log |
|
|
|
| 10 Hz | ||||
| 100 kHz |
On your plot, add the line
![]() , where again
, where again ![]() ,
using the nominal
component values. Does it agree with the data?
,
using the nominal
component values. Does it agree with the data?
For info, write to: [email protected]