|
extrema home page
About extrema
extrema is a powerful visualization and data analysis tool that enables researchers to quickly distill their large, complex data sets into meaningful information. Its flexibility, sophistication, and power allow you to easily develop your own commands and create highly customized graphs.
With its roots at a particle physics laboratory (TRIUMF), extrema was designed first and foremost to be of the greatest practical use to researchers. The legacy of this design approach is a data analysis and visualization package that is both extremely powerful and easy-to-use. The average user can be doing productive work within minutes of first starting the program, yet its features and functionality are nearly inexhaustible!
- Increased efficiency: extrema's dual mode of operation offers both ease-of-use and power. For easy or routine tasks, use the Graphical User Interface. For more complex tasks, or for large-volume, repetitive jobs, use the built-in command language or scripting mode.
- Increased productivity: extrema has been designed with ease-of-use as a priority. Within hours, you will be able to interactively manipulate and plot your data, customize the output, and easily import it directly into your papers.
- Increased confidence: The extrema technology was developed for nuclear and particle physics research, among the most demanding fields of data analysis there are. It is also proven in a wide variety of other scientific fields at many leading universities, national laboratories, government agencies, and industry.
Earlier versions of extrema have been released by TRIUMF under the product name physica. The switch from Physica to extrema is effortless, and there are many new features to be gained.
 The Problem:
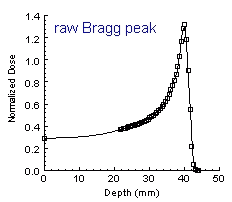
The radiation dose resulting from a proton passing
through living tissue has a sharp, narrow peak, known as a Bragg peak.
In certain cancer therapies, the desired radiation dose should have a
broad, flat peak, where the flat section corresponds to the extent of
the tumour being treated. The problem is how to deliver the dosage
in a broad, flat distribution when the radiation is naturally
deposited in narrow Bragg peaks. The Problem:
The radiation dose resulting from a proton passing
through living tissue has a sharp, narrow peak, known as a Bragg peak.
In certain cancer therapies, the desired radiation dose should have a
broad, flat peak, where the flat section corresponds to the extent of
the tumour being treated. The problem is how to deliver the dosage
in a broad, flat distribution when the radiation is naturally
deposited in narrow Bragg peaks.
 Background: Proton Beam Therapy uses protons to fight
cancer. Protons are stable, positively-charged subatomic particles
with a mass 1800 times that of an electron. Protons slow down
relatively fast when entering biological tissue, and most of their
energy is deposited, with little scatter, at the end of their path in
a peak called a Bragg peak. The depth at which the peak occurs can be
controlled by the amount of energy the protons are given by their
accelerator. The proton's dose of radiation is released in an exact
shape and depth within the body. Tissues in front of the target
receive a very small dose, while tissues adjacent to the tumor receive
virtually none. The medical value of this effect was first published
in 1947 in a paper entitled "Radiological Use of Fast Protons" by
Robert R. Wilson. Proton beam therapy has demonstrated success for
the treatment of selected tumours. More than 20,000 patients have been
treated with protons or light ions in research laboratories or
hospitals around the world. Background: Proton Beam Therapy uses protons to fight
cancer. Protons are stable, positively-charged subatomic particles
with a mass 1800 times that of an electron. Protons slow down
relatively fast when entering biological tissue, and most of their
energy is deposited, with little scatter, at the end of their path in
a peak called a Bragg peak. The depth at which the peak occurs can be
controlled by the amount of energy the protons are given by their
accelerator. The proton's dose of radiation is released in an exact
shape and depth within the body. Tissues in front of the target
receive a very small dose, while tissues adjacent to the tumor receive
virtually none. The medical value of this effect was first published
in 1947 in a paper entitled "Radiological Use of Fast Protons" by
Robert R. Wilson. Proton beam therapy has demonstrated success for
the treatment of selected tumours. More than 20,000 patients have been
treated with protons or light ions in research laboratories or
hospitals around the world.
Solution:
To begin with, we have an empirically measured Bragg peak that
describes the radiation dose along the path of the proton. We fit
this data to a smooth curve to describe the peak as a function. We
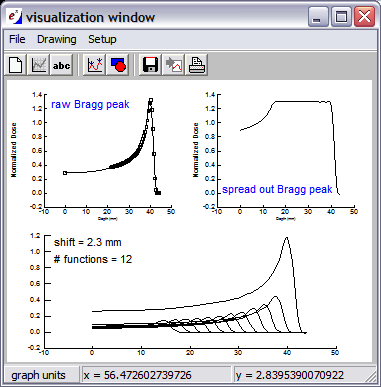
can spread the peak by adding together a weighted set of these
functions with various shifts in the independent variable. This
corresponds to using protons at different energies and intensities.
extrema calculates the best weights to apply to each function in the set, so
that their sum results in a flat spread-out Bragg peak. This script
allows the user to explore how these functions can be used to attain a
flat distribution across the desired range, by supplying the number of
functions and their relative shift with respect to each other. The
script plots the weighted individual functions and the spread-out
Bragg peak that results from them. It also creates an output vector
containing the calculated weight values.
Try it yourself: extrema macro performs the analysis using this raw data file, bragg.dat
The Problem:
We were given the job of figuring out the minimum amount of water
pipe necessary to connect up the houses on a street to a water main. We
had to determine where to dig a straight trench down the street for the
water main pipe. The houses are set back from the street by
varying distances, and ideally each house should be about 5 meters from the
water main. The problem was to find the trench that would result in the
minimum usage of water pipe segments from the main to the houses, and
the total length of the pipe needed.
 Solution:
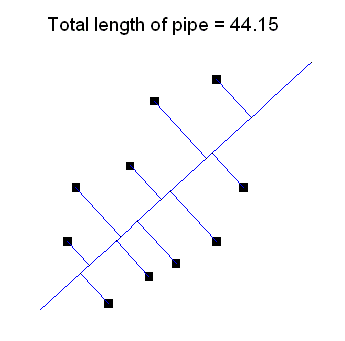
We have the (x,y) coordinates of the connections to the houses stored
in a file, Solution:
We have the (x,y) coordinates of the connections to the houses stored
in a file, houses.dat.
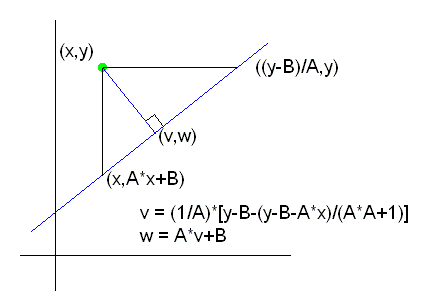
Remember from plane geometry that the distance from point (x,y) to a straight
line with slope A and y-intercept B is given by
$$
D = \frac{|A*x+B-y|}{\sqrt{A^2+1}}
$$
We want
to minimize the connecting pipe lengths by varying the free parameters A
and B. The following short script does just that:
LENGTH_GOAL = 5                       ! try to achieve this goal
READ\-MESSAGES houses.dat X Y         ! read in the house positions
SCALAR\FIT A B                        ! declare the free parameters
A = 1                                 ! initialize
B = 1                                 ! initialize
D[1:LEN(X)] = LENGTH_GOAL             !
DISTANCE = 'ABS(A*X+B-Y)/SQRT(A*A+1)' !
FIT\-MESSAGES D=SQRT(DISTANCE)        ! do the fit
FIT\UPDATE PIECES                     ! redo using calculated A and B
STATISTICS PIECES PSUM\SUM            ! the total length of pipe needed
DISPLAY 'Total length of pipe = '//RCHAR(PSUM,'%4.2f')
Since least squares is used for fitting, we take the square root of the
expression. Note that we have more than one independent variable in the
expression. Extension to multidimensional cases is straightforward.
The problem of fitting to a scattered set of points with a straight line
which is, on the average, a fixed number of units away will, in general,
have two solutions, and which one you get will depend on the starting values
of the free parameters.

Try it yourself: extrema macro performs the analysis using this raw data file, houses.dat
Ease of Use
- A rich graphical user interface lets you quickly tackle one-off problems.
- For more elaborate tasks, the intuitive command language makes script writing easy. For example, to graph two data vectors x and y against each other, just type "
graph x y".
- Automatic script-writing mode will create a script based on your GUI point-and-click actions. Write scripts without typing a single command!
- Data manipulation is easy with extrema's automatic expression evaluation. For instance, if you have 10,000 (x,y) data coordinates stored in vectors
x and y, you can instantly compute each of their distances from the origin with "d = sqrt(x^2 + y^2)".
- Simple, easy-to-understand programming constructs allow you to write code with little or no programming experience.
- The GUI gives you ALL the power of the low-level language, and vice versa.
3-D Graphing
- Contour plots: colour, legend, area/volume tabulations, control over contour label size, colour, separation, etc.
- Density plots: derivatives, random point type, box type, colour filled regions, dithering patterns with automatic or user defined patterns, diffusion type, profiles, legend, area/volume tabulations, etc.
2-D Graphing
- Customized 2-D line graphs, scatter plots, horizontal or vertical bar charts, each with a large variety of type styles and fonts of any size and color
- Customized or automatic legends
- Multiple axes with arbitrary axis positioning
- Fill the area between data curves or fill individual histogram bars
- Logarithmic axes, to any base, including e
- Axis scaling can be automatic or user set (including commensurate axes)
- Labels can optionally follow the curves on rescaling a graph
- Many plotting symbols, with control over size, colour and angle
- Complete control over axis appearance (short/long tic mark length and angle, separation between tic marks and axis labels, axis angle, length and location, axis labels size, colour, font, number of digits, etc.)
Data Reduction & Analysis
- Differentiate/Integrate an arbitrary expression
- Interpolate 1-D or 2-D data using various methods (linear, Lagrange, weighted splines under tension, Fritsch-Carlson, etc.)
- Smooth data using various methods (weighted splines under tension, Savitzky-Golay filters, etc.)
- Convolution and deconvolution of data
- Integral transforms of arbitrary expressions
- Fast Fourier Transforms and Inverse FFT's
- Reorganize data (sort, step, roll, wrap, etc.)
- Weighted (re-)binning of 1-D or 2-D data into automatic or user defined bins (specified by centres or edges)
- Find multiple real roots of an expression
- Recursive and non-recursive digital filters
- Manual or automatic determination of data extrema using graphics cursor
- Fit data with an arbitrary, non-linear, expression involving up to 25 variable parameters
- Ellipse fitting
- Calculation of parameters for least-squares fit using adjustable parameters
- User defined and named variables (scalars, vectors, matrices, strings, arrays of strings)
- Full indexing on variables and expressions
- Literal vectors may be specified as a list or a range
- Boolean operators (<, >, &, etc.)
- Array operators (inner/outer product, matrix transpose, etc.)
- Over 200 built-in functions including: scalar type (Bessel, Clebsch-Gordan, etc.); array type (sum, product, loop, where, etc.); string type (case, date/time, etc.)
- Mathematical/character expressions may appear in any suitable command parameter
- Use character variables to substitute for complicated expression substrings
Data Input/Output
- Display the history of variables
- Read data from binary or ASCII files by formats or space/tab/comma separated columns
- Output data to binary or ASCII files by formats or in columns
- Dynamic allocation of arrays
- Digitize data from a displayed plot
extrema's Built-In Language
- Scripting capability with up to 20 nesting levels and with parameter passing
- Script library of `super' commands
- Nested looping, branching and conditional statements in scripts
- Display messages, prompt for user input from within a script
- Return to interactive mode from within a script, and later resume script execution
- Create a script interactively
General Graphics Utilities
- Unlimited text capabilities for titles, labels, and annotations
- Multiple windows within the graphing area
- Any number of charts of any mixed type on a single picture
- High quality graphics display
- Interactive entry of lines, arcs, geometric figures, and text
Other Features
- Comprehensive on-line documentation: instant help for any command, or interactive browsing through help library
- Keyword searching
- Save/Restore an entire extrema session, including graphics
- Keep a journal file of all command input and message output
- Dynamic input line recall buffers allow recall/edit of commands using the arrow keys
|